FedbankFinancial FEDFINA full analysis,charts,indicators,moving averages,SMA,DMA,EMA,ADX,MACD,RSIFedbank Financial FEDFINA WideScreen charts, DMA,SMA,EMA technical analysis, forecast prediction, by indicators ADX,MACD,RSI,CCI NSE stock exchange
Daily price and charts and targets FedbankFinancial Strong Daily Stock price targets for FedbankFinancial FEDFINA are 141.47 and 143.83 | Daily Target 1 | 140.98 | | Daily Target 2 | 141.96 | | Daily Target 3 | 143.34 | | Daily Target 4 | 144.32 | | Daily Target 5 | 145.7 |
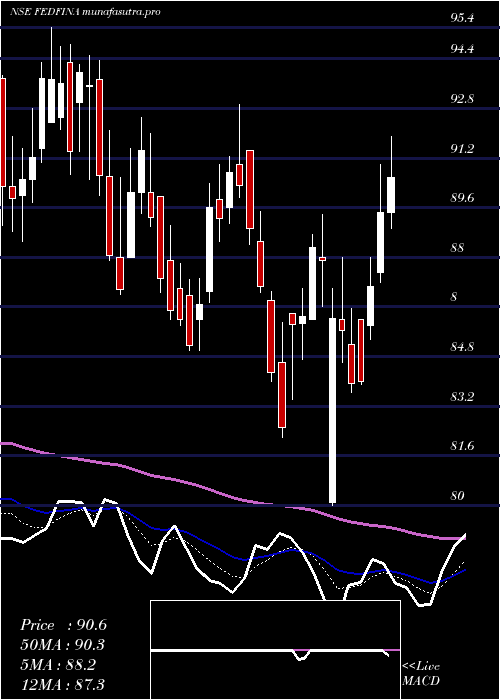
Daily price and volume Fedbank Financial
| Date |
Closing |
Open |
Range |
Volume |
Tue 28 October 2025 |
142.94 (-1.23%) |
144.72 |
142.36 - 144.72 |
0.5005 times |
Mon 27 October 2025 |
144.72 (2.35%) |
142.62 |
141.92 - 145.95 |
0.6609 times |
Fri 24 October 2025 |
141.40 (-0.65%) |
142.99 |
139.21 - 143.38 |
0.6564 times |
Thu 23 October 2025 |
142.32 (-6.28%) |
151.85 |
141.61 - 154.00 |
1.7171 times |
Tue 21 October 2025 |
151.85 (3.71%) |
151.00 |
149.35 - 154.00 |
0.3793 times |
Mon 20 October 2025 |
146.42 (-2.35%) |
154.00 |
144.01 - 154.00 |
2.1285 times |
Fri 17 October 2025 |
149.94 (-0.47%) |
151.99 |
148.02 - 154.38 |
1.1756 times |
Thu 16 October 2025 |
150.65 (-4.04%) |
158.90 |
147.50 - 158.90 |
1.2608 times |
Wed 15 October 2025 |
157.00 (0.63%) |
156.03 |
153.54 - 157.99 |
0.5613 times |
Tue 14 October 2025 |
156.02 (-2.76%) |
160.46 |
154.57 - 161.91 |
0.9597 times |
Mon 13 October 2025 |
160.45 (2.91%) |
156.00 |
154.79 - 161.69 |
0.8801 times |
Weekly price and charts FedbankFinancial Strong weekly Stock price targets for FedbankFinancial FEDFINA are 142.43 and 146.46 | Weekly Target 1 | 139.57 | | Weekly Target 2 | 141.26 | | Weekly Target 3 | 143.60333333333 | | Weekly Target 4 | 145.29 | | Weekly Target 5 | 147.63 |
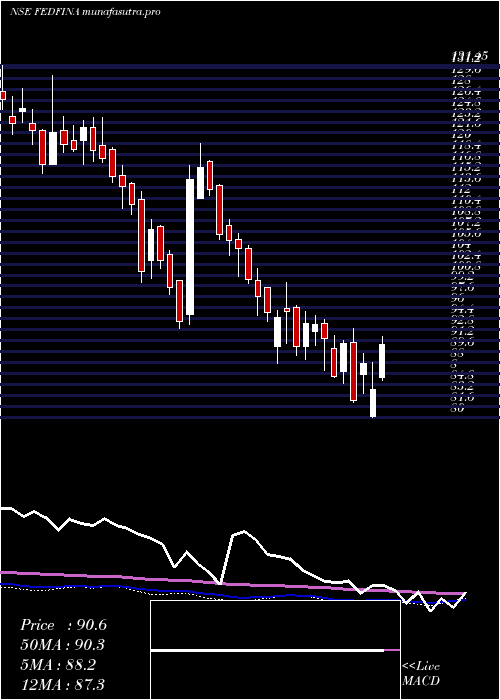
Weekly price and volumes for Fedbank Financial
| Date |
Closing |
Open |
Range |
Volume |
Tue 28 October 2025 |
142.94 (1.09%) |
142.62 |
141.92 - 145.95 |
0.3072 times |
Fri 24 October 2025 |
141.40 (-5.7%) |
154.00 |
139.21 - 154.00 |
1.2913 times |
Fri 17 October 2025 |
149.94 (-3.84%) |
156.00 |
147.50 - 161.91 |
1.2797 times |
Fri 10 October 2025 |
155.92 (0.6%) |
156.60 |
152.00 - 166.80 |
1.0796 times |
Fri 03 October 2025 |
154.99 (4.27%) |
147.35 |
144.05 - 157.25 |
0.9782 times |
Fri 26 September 2025 |
148.64 (0.43%) |
151.69 |
146.44 - 156.14 |
1.1945 times |
Fri 19 September 2025 |
148.00 (-1.39%) |
151.80 |
145.91 - 151.80 |
0.8049 times |
Fri 12 September 2025 |
150.08 (10.04%) |
138.54 |
135.62 - 157.80 |
1.9627 times |
Fri 05 September 2025 |
136.39 (0.54%) |
136.99 |
130.77 - 142.20 |
0.544 times |
Fri 29 August 2025 |
135.66 (-4.48%) |
143.00 |
132.98 - 144.62 |
0.5579 times |
Fri 22 August 2025 |
142.03 (5.08%) |
135.17 |
132.05 - 143.20 |
1.0976 times |
Monthly price and charts FedbankFinancial Strong monthly Stock price targets for FedbankFinancial FEDFINA are 127.28 and 154.87 | Monthly Target 1 | 122.06 | | Monthly Target 2 | 132.5 | | Monthly Target 3 | 149.65 | | Monthly Target 4 | 160.09 | | Monthly Target 5 | 177.24 |
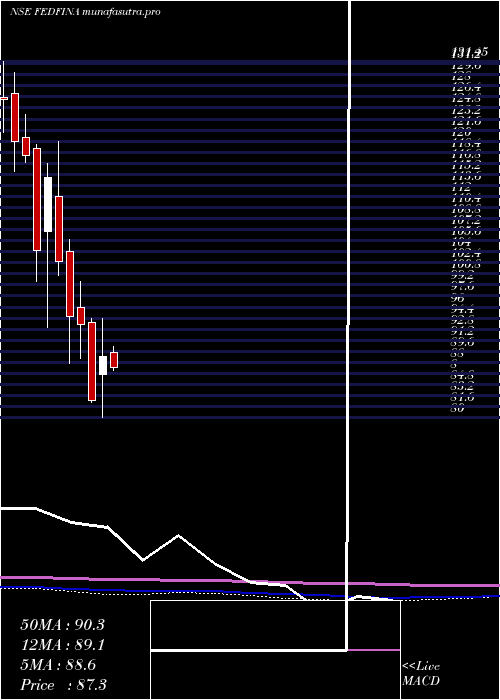
Monthly price and volumes Fedbank Financial
| Date |
Closing |
Open |
Range |
Volume |
Tue 28 October 2025 |
142.94 (-7.43%) |
155.20 |
139.21 - 166.80 |
1.6498 times |
Tue 30 September 2025 |
154.42 (13.83%) |
136.99 |
130.77 - 157.80 |
1.9391 times |
Fri 29 August 2025 |
135.66 (0.11%) |
135.51 |
122.70 - 144.62 |
1.1505 times |
Thu 31 July 2025 |
135.51 (18.24%) |
115.53 |
113.48 - 137.40 |
1.7156 times |
Mon 30 June 2025 |
114.61 (16.73%) |
98.28 |
97.76 - 122.58 |
1.0238 times |
Fri 30 May 2025 |
98.18 (10.48%) |
89.40 |
83.57 - 99.25 |
0.6142 times |
Wed 30 April 2025 |
88.87 (7.71%) |
86.20 |
80.00 - 94.40 |
0.4839 times |
Fri 28 March 2025 |
82.51 (-11.8%) |
93.74 |
82.20 - 94.33 |
0.5312 times |
Fri 28 February 2025 |
93.55 (-1.16%) |
95.94 |
88.50 - 99.70 |
0.298 times |
Fri 31 January 2025 |
94.65 (-7.74%) |
103.99 |
87.88 - 105.80 |
0.594 times |
Tue 31 December 2024 |
102.59 (-10.62%) |
111.96 |
100.61 - 120.00 |
0.566 times |
DMA SMA EMA moving averages of Fedbank Financial FEDFINA
DMA (daily moving average) of Fedbank Financial FEDFINA
| DMA period | DMA value | | 5 day DMA | 144.65 | | 12 day DMA | 149.97 | | 20 day DMA | 152.86 | | 35 day DMA | 150.99 | | 50 day DMA | 146.86 | | 100 day DMA | 133.5 | | 150 day DMA | 118.99 | | 200 day DMA | 112.58 | EMA (exponential moving average) of Fedbank Financial FEDFINA
| EMA period | EMA current | EMA prev | EMA prev2 | | 5 day EMA | 144.71 | 145.59 | 146.03 | | 12 day EMA | 148.19 | 149.15 | 149.96 | | 20 day EMA | 149.45 | 150.13 | 150.7 | | 35 day EMA | 147.91 | 148.2 | 148.41 | | 50 day EMA | 145.1 | 145.19 | 145.21 |
SMA (simple moving average) of Fedbank Financial FEDFINA
| SMA period | SMA current | SMA prev | SMA prev2 | | 5 day SMA | 144.65 | 145.34 | 146.39 | | 12 day SMA | 149.97 | 151.26 | 152.52 | | 20 day SMA | 152.86 | 153.15 | 153.38 | | 35 day SMA | 150.99 | 150.81 | 150.63 | | 50 day SMA | 146.86 | 146.58 | 146.28 | | 100 day SMA | 133.5 | 133.1 | 132.66 | | 150 day SMA | 118.99 | 118.64 | 118.25 | | 200 day SMA | 112.58 | 112.38 | 112.18 |
|
|
