FcsSoftware FCSSOFT full analysis,charts,indicators,moving averages,SMA,DMA,EMA,ADX,MACD,RSIFcs Software FCSSOFT WideScreen charts, DMA,SMA,EMA technical analysis, forecast prediction, by indicators ADX,MACD,RSI,CCI NSE stock exchange
operates under IT Consulting & Software sector
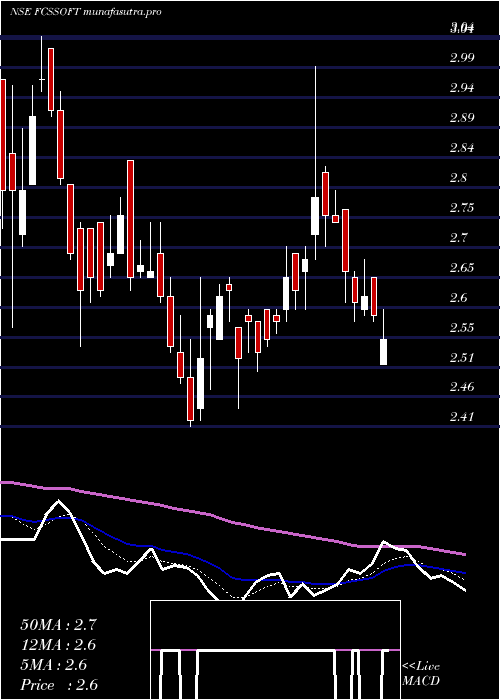
Daily price and charts and targets FcsSoftware Strong Daily Stock price targets for FcsSoftware FCSSOFT are 2.2 and 2.31 | Daily Target 1 | 2.18 | | Daily Target 2 | 2.22 | | Daily Target 3 | 2.29 | | Daily Target 4 | 2.33 | | Daily Target 5 | 2.4 |
Daily price and volume Fcs Software
| Date |
Closing |
Open |
Range |
Volume |
Tue 28 October 2025 |
2.26 (-3.83%) |
2.35 |
2.25 - 2.36 |
0.4112 times |
Mon 27 October 2025 |
2.35 (-1.67%) |
2.31 |
2.31 - 2.45 |
0.7481 times |
Fri 24 October 2025 |
2.39 (-4.78%) |
2.53 |
2.33 - 2.53 |
1.0906 times |
Thu 23 October 2025 |
2.51 (18.96%) |
2.15 |
2.13 - 2.53 |
6.5595 times |
Tue 21 October 2025 |
2.11 (0.96%) |
2.10 |
2.09 - 2.13 |
0.0937 times |
Mon 20 October 2025 |
2.09 (-0.95%) |
2.12 |
2.08 - 2.13 |
0.2752 times |
Fri 17 October 2025 |
2.11 (-0.94%) |
2.13 |
2.10 - 2.15 |
0.1889 times |
Thu 16 October 2025 |
2.13 (0.95%) |
2.11 |
2.11 - 2.17 |
0.1806 times |
Wed 15 October 2025 |
2.11 (-1.4%) |
2.14 |
2.10 - 2.14 |
0.2648 times |
Tue 14 October 2025 |
2.14 (-1.38%) |
2.17 |
2.13 - 2.20 |
0.1875 times |
Mon 13 October 2025 |
2.17 (-0.46%) |
2.18 |
2.15 - 2.20 |
0.1941 times |
Weekly price and charts FcsSoftware Strong weekly Stock price targets for FcsSoftware FCSSOFT are 2.16 and 2.36 | Weekly Target 1 | 2.12 | | Weekly Target 2 | 2.19 | | Weekly Target 3 | 2.32 | | Weekly Target 4 | 2.39 | | Weekly Target 5 | 2.52 |
Weekly price and volumes for Fcs Software
| Date |
Closing |
Open |
Range |
Volume |
Tue 28 October 2025 |
2.26 (-5.44%) |
2.31 |
2.25 - 2.45 |
0.6719 times |
Fri 24 October 2025 |
2.39 (13.27%) |
2.12 |
2.08 - 2.53 |
4.6482 times |
Fri 17 October 2025 |
2.11 (-3.21%) |
2.18 |
2.10 - 2.20 |
0.5889 times |
Fri 10 October 2025 |
2.18 (-2.68%) |
2.24 |
2.14 - 2.25 |
0.7378 times |
Fri 03 October 2025 |
2.24 (-1.75%) |
2.30 |
2.22 - 2.31 |
0.403 times |
Fri 26 September 2025 |
2.28 (-5.79%) |
2.42 |
2.26 - 2.43 |
0.6989 times |
Fri 19 September 2025 |
2.42 (0.41%) |
2.41 |
2.38 - 2.45 |
0.711 times |
Fri 12 September 2025 |
2.41 (0%) |
2.41 |
2.39 - 2.45 |
0.4795 times |
Fri 05 September 2025 |
2.41 (0.84%) |
2.40 |
2.32 - 2.49 |
0.4812 times |
Fri 29 August 2025 |
2.39 (-2.05%) |
2.41 |
2.38 - 2.54 |
0.5795 times |
Fri 22 August 2025 |
2.44 (2.52%) |
2.59 |
2.41 - 2.59 |
0.5241 times |
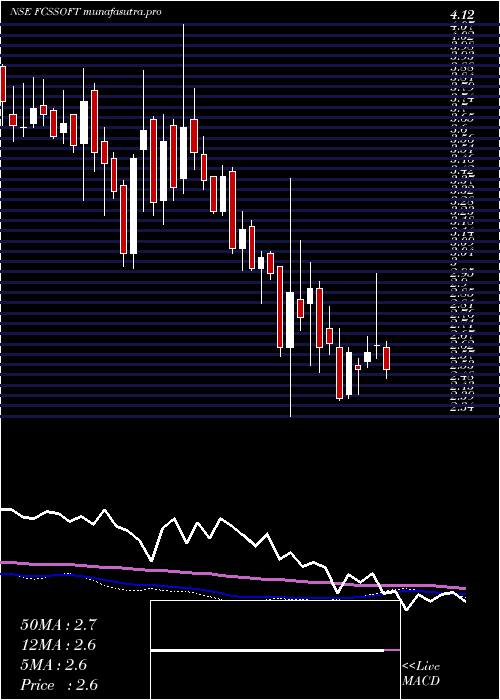
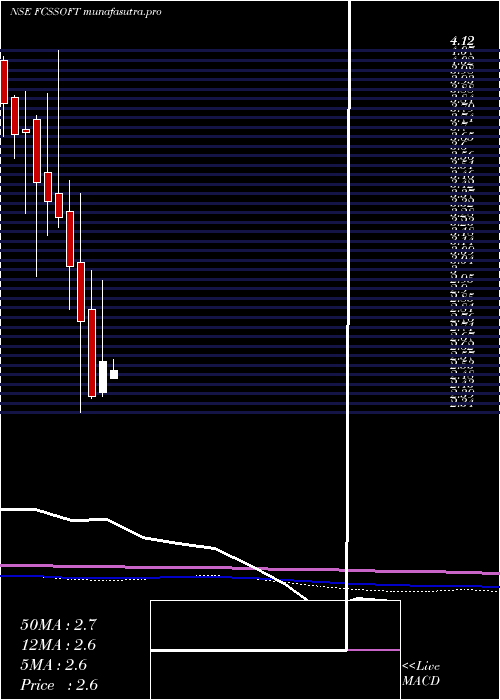
Monthly price and charts FcsSoftware Strong monthly Stock price targets for FcsSoftware FCSSOFT are 2.17 and 2.62 | Monthly Target 1 | 1.84 | | Monthly Target 2 | 2.05 | | Monthly Target 3 | 2.29 | | Monthly Target 4 | 2.5 | | Monthly Target 5 | 2.74 |
Monthly price and volumes Fcs Software
| Date |
Closing |
Open |
Range |
Volume |
Tue 28 October 2025 |
2.26 (0%) |
2.25 |
2.08 - 2.53 |
1.6757 times |
Tue 30 September 2025 |
2.26 (-5.44%) |
2.40 |
2.25 - 2.49 |
0.6155 times |
Fri 29 August 2025 |
2.39 (-5.53%) |
2.54 |
2.37 - 2.59 |
0.5174 times |
Thu 31 July 2025 |
2.53 (-10.6%) |
2.90 |
2.51 - 3.05 |
0.8796 times |
Mon 30 June 2025 |
2.83 (8.02%) |
2.63 |
2.49 - 3.00 |
1.6035 times |
Fri 30 May 2025 |
2.62 (1.16%) |
2.51 |
2.39 - 2.85 |
0.7624 times |
Wed 30 April 2025 |
2.59 (7.02%) |
2.44 |
2.42 - 2.99 |
0.6901 times |
Fri 28 March 2025 |
2.42 (-13.26%) |
2.85 |
2.41 - 3.04 |
0.9294 times |
Fri 28 February 2025 |
2.79 (-8.82%) |
3.08 |
2.34 - 3.42 |
1.3939 times |
Fri 31 January 2025 |
3.06 (-7.27%) |
3.33 |
2.85 - 3.48 |
0.9323 times |
Tue 31 December 2024 |
3.30 (-2.37%) |
3.42 |
3.25 - 4.12 |
1.4469 times |
DMA SMA EMA moving averages of Fcs Software FCSSOFT
DMA (daily moving average) of Fcs Software FCSSOFT
| DMA period | DMA value | | 5 day DMA | 2.32 | | 12 day DMA | 2.21 | | 20 day DMA | 2.22 | | 35 day DMA | 2.29 | | 50 day DMA | 2.33 | | 100 day DMA | 2.49 | | 150 day DMA | 2.53 | | 200 day DMA | 2.63 | EMA (exponential moving average) of Fcs Software FCSSOFT
| EMA period | EMA current | EMA prev | EMA prev2 | | 5 day EMA | 2.3 | 2.32 | 2.3 | | 12 day EMA | 2.26 | 2.26 | 2.24 | | 20 day EMA | 2.26 | 2.26 | 2.25 | | 35 day EMA | 2.27 | 2.27 | 2.27 | | 50 day EMA | 2.34 | 2.34 | 2.34 |
SMA (simple moving average) of Fcs Software FCSSOFT
| SMA period | SMA current | SMA prev | SMA prev2 | | 5 day SMA | 2.32 | 2.29 | 2.24 | | 12 day SMA | 2.21 | 2.2 | 2.19 | | 20 day SMA | 2.22 | 2.22 | 2.21 | | 35 day SMA | 2.29 | 2.29 | 2.29 | | 50 day SMA | 2.33 | 2.34 | 2.34 | | 100 day SMA | 2.49 | 2.49 | 2.49 | | 150 day SMA | 2.53 | 2.53 | 2.53 | | 200 day SMA | 2.63 | 2.64 | 2.64 |
|
|
