FineotexChemical FCL full analysis,charts,indicators,moving averages,SMA,DMA,EMA,ADX,MACD,RSIFineotex Chemical FCL WideScreen charts, DMA,SMA,EMA technical analysis, forecast prediction, by indicators ADX,MACD,RSI,CCI NSE stock exchange
operates under Specialty Chemicals sector
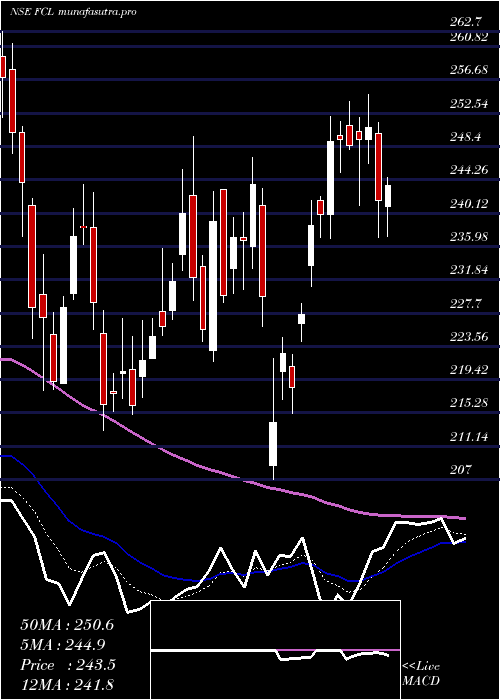
Daily price and charts and targets FineotexChemical Strong Daily Stock price targets for FineotexChemical FCL are 253.43 and 259.84 | Daily Target 1 | 248.49 | | Daily Target 2 | 251.95 | | Daily Target 3 | 254.9 | | Daily Target 4 | 258.36 | | Daily Target 5 | 261.31 |
Daily price and volume Fineotex Chemical
| Date |
Closing |
Open |
Range |
Volume |
Tue 28 October 2025 |
255.41 (0.55%) |
254.01 |
251.44 - 257.85 |
1.99 times |
Mon 27 October 2025 |
254.01 (-0.82%) |
258.00 |
248.81 - 258.80 |
1.3767 times |
Fri 24 October 2025 |
256.12 (3.36%) |
247.80 |
247.28 - 257.50 |
2.3607 times |
Thu 23 October 2025 |
247.80 (0.77%) |
248.68 |
246.16 - 249.80 |
0.6723 times |
Tue 21 October 2025 |
245.90 (0.87%) |
244.99 |
244.00 - 246.80 |
0.3014 times |
Mon 20 October 2025 |
243.78 (-0.32%) |
245.00 |
241.50 - 246.05 |
0.4537 times |
Fri 17 October 2025 |
244.56 (-0.55%) |
247.50 |
240.70 - 247.50 |
0.5613 times |
Thu 16 October 2025 |
245.92 (2.72%) |
240.15 |
238.35 - 246.95 |
0.9641 times |
Wed 15 October 2025 |
239.41 (1.05%) |
237.00 |
235.85 - 241.00 |
0.5321 times |
Tue 14 October 2025 |
236.92 (-0.62%) |
240.98 |
235.60 - 240.98 |
0.7878 times |
Mon 13 October 2025 |
238.39 (-2.57%) |
244.20 |
237.10 - 244.30 |
0.7858 times |
Weekly price and charts FineotexChemical Strong weekly Stock price targets for FineotexChemical FCL are 247.12 and 257.11 | Weekly Target 1 | 244.35 | | Weekly Target 2 | 249.88 | | Weekly Target 3 | 254.34 | | Weekly Target 4 | 259.87 | | Weekly Target 5 | 264.33 |
Weekly price and volumes for Fineotex Chemical
| Date |
Closing |
Open |
Range |
Volume |
Tue 28 October 2025 |
255.41 (-0.28%) |
258.00 |
248.81 - 258.80 |
0.1864 times |
Fri 24 October 2025 |
256.12 (4.73%) |
245.00 |
241.50 - 257.50 |
0.2097 times |
Fri 17 October 2025 |
244.56 (-0.04%) |
244.20 |
235.60 - 247.50 |
0.201 times |
Fri 10 October 2025 |
244.67 (-2.32%) |
251.85 |
238.29 - 252.00 |
0.2287 times |
Fri 03 October 2025 |
250.49 (0.02%) |
261.71 |
244.50 - 265.00 |
1.2281 times |
Fri 26 September 2025 |
250.44 (6.27%) |
235.66 |
231.00 - 270.80 |
7.4599 times |
Fri 19 September 2025 |
235.66 (-0.54%) |
236.96 |
235.00 - 241.68 |
0.1039 times |
Fri 12 September 2025 |
236.93 (0.03%) |
237.79 |
233.41 - 244.99 |
0.2028 times |
Fri 05 September 2025 |
236.85 (-0.67%) |
238.45 |
234.30 - 246.49 |
0.0951 times |
Fri 29 August 2025 |
238.45 (-6.51%) |
255.00 |
234.25 - 256.65 |
0.0844 times |
Fri 22 August 2025 |
255.05 (9.09%) |
235.00 |
235.00 - 259.80 |
0.2787 times |
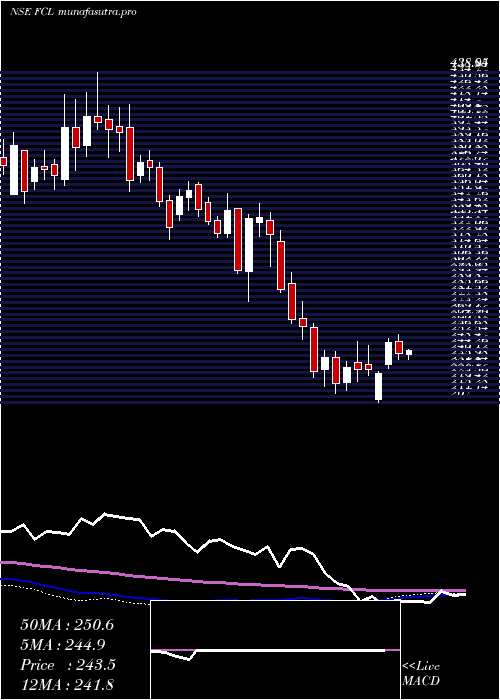
Monthly price and charts FineotexChemical Strong monthly Stock price targets for FineotexChemical FCL are 245.51 and 268.71 | Monthly Target 1 | 226.74 | | Monthly Target 2 | 241.07 | | Monthly Target 3 | 249.93666666667 | | Monthly Target 4 | 264.27 | | Monthly Target 5 | 273.14 |
Monthly price and volumes Fineotex Chemical
| Date |
Closing |
Open |
Range |
Volume |
Tue 28 October 2025 |
255.41 (2.38%) |
249.20 |
235.60 - 258.80 |
0.4963 times |
Tue 30 September 2025 |
249.47 (4.62%) |
238.45 |
231.00 - 270.80 |
4.114 times |
Fri 29 August 2025 |
238.45 (-8.59%) |
261.35 |
226.00 - 264.95 |
0.3312 times |
Thu 31 July 2025 |
260.85 (-6.73%) |
280.40 |
256.60 - 287.00 |
0.406 times |
Mon 30 June 2025 |
279.68 (17.2%) |
238.80 |
236.64 - 290.66 |
1.5748 times |
Fri 30 May 2025 |
238.64 (0.4%) |
239.20 |
221.61 - 269.80 |
0.5408 times |
Wed 30 April 2025 |
237.69 (3.42%) |
233.30 |
207.00 - 254.80 |
0.3956 times |
Fri 28 March 2025 |
229.83 (0.6%) |
229.98 |
213.10 - 249.70 |
0.7109 times |
Fri 28 February 2025 |
228.45 (-29.66%) |
320.00 |
224.55 - 327.75 |
0.812 times |
Fri 31 January 2025 |
324.80 (-1.64%) |
331.45 |
278.00 - 354.00 |
0.6186 times |
Tue 31 December 2024 |
330.20 (-6.19%) |
351.40 |
322.75 - 362.50 |
0.2126 times |

DMA SMA EMA moving averages of Fineotex Chemical FCL
DMA (daily moving average) of Fineotex Chemical FCL
| DMA period | DMA value | | 5 day DMA | 251.85 | | 12 day DMA | 246.07 | | 20 day DMA | 246.8 | | 35 day DMA | 243.34 | | 50 day DMA | 243.58 | | 100 day DMA | 254.72 | | 150 day DMA | 249.94 | | 200 day DMA | 257.5 | EMA (exponential moving average) of Fineotex Chemical FCL
| EMA period | EMA current | EMA prev | EMA prev2 | | 5 day EMA | 252.22 | 250.62 | 248.93 | | 12 day EMA | 248.5 | 247.24 | 246.01 | | 20 day EMA | 246.64 | 245.72 | 244.85 | | 35 day EMA | 245.01 | 244.4 | 243.83 | | 50 day EMA | 243.66 | 243.18 | 242.74 |
SMA (simple moving average) of Fineotex Chemical FCL
| SMA period | SMA current | SMA prev | SMA prev2 | | 5 day SMA | 251.85 | 249.52 | 247.63 | | 12 day SMA | 246.07 | 244.78 | 243.93 | | 20 day SMA | 246.8 | 246.55 | 246.11 | | 35 day SMA | 243.34 | 242.81 | 242.34 | | 50 day SMA | 243.58 | 243.19 | 242.68 | | 100 day SMA | 254.72 | 254.64 | 254.6 | | 150 day SMA | 249.94 | 249.74 | 249.52 | | 200 day SMA | 257.5 | 257.86 | 258.3 |
|
|
