ExicomTele EXICOM full analysis,charts,indicators,moving averages,SMA,DMA,EMA,ADX,MACD,RSIExicom Tele EXICOM WideScreen charts, DMA,SMA,EMA technical analysis, forecast prediction, by indicators ADX,MACD,RSI,CCI NSE stock exchange
Daily price and charts and targets ExicomTele Strong Daily Stock price targets for ExicomTele EXICOM are 139.05 and 140.96 | Daily Target 1 | 137.59 | | Daily Target 2 | 138.6 | | Daily Target 3 | 139.5 | | Daily Target 4 | 140.51 | | Daily Target 5 | 141.41 |
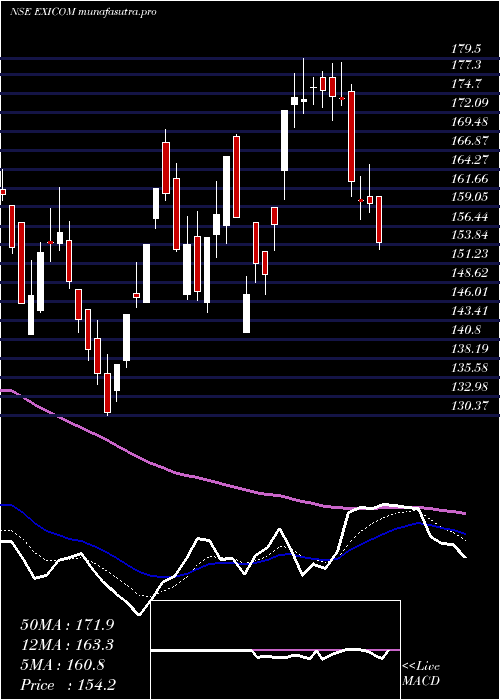
Daily price and volume Exicom Tele
| Date |
Closing |
Open |
Range |
Volume |
Wed 29 October 2025 |
139.61 (0.42%) |
138.50 |
138.49 - 140.40 |
1.0721 times |
Tue 28 October 2025 |
139.02 (-0.01%) |
139.65 |
138.00 - 140.40 |
1.0177 times |
Mon 27 October 2025 |
139.04 (-0.27%) |
140.50 |
138.60 - 141.80 |
0.9742 times |
Fri 24 October 2025 |
139.41 (-2.11%) |
141.64 |
139.00 - 142.42 |
1.1065 times |
Thu 23 October 2025 |
142.42 (1.03%) |
141.50 |
140.75 - 143.89 |
1.4417 times |
Tue 21 October 2025 |
140.97 (1.35%) |
140.90 |
139.13 - 144.00 |
0.5149 times |
Mon 20 October 2025 |
139.09 (-1.77%) |
141.69 |
138.88 - 142.39 |
1.1405 times |
Fri 17 October 2025 |
141.59 (-0.53%) |
142.12 |
140.31 - 143.51 |
0.8821 times |
Thu 16 October 2025 |
142.34 (0.32%) |
142.85 |
142.00 - 144.39 |
0.9837 times |
Wed 15 October 2025 |
141.89 (0.85%) |
140.95 |
140.70 - 142.45 |
0.8668 times |
Tue 14 October 2025 |
140.70 (-1.97%) |
143.70 |
140.00 - 144.86 |
1.4541 times |
Weekly price and charts ExicomTele Strong weekly Stock price targets for ExicomTele EXICOM are 136.91 and 140.71 | Weekly Target 1 | 136 | | Weekly Target 2 | 137.81 | | Weekly Target 3 | 139.80333333333 | | Weekly Target 4 | 141.61 | | Weekly Target 5 | 143.6 |
Weekly price and volumes for Exicom Tele
| Date |
Closing |
Open |
Range |
Volume |
Wed 29 October 2025 |
139.61 (0.14%) |
140.50 |
138.00 - 141.80 |
0.2137 times |
Fri 24 October 2025 |
139.41 (-1.54%) |
141.69 |
138.88 - 144.00 |
0.2931 times |
Fri 17 October 2025 |
141.59 (-1.9%) |
144.00 |
140.00 - 145.22 |
0.3712 times |
Fri 10 October 2025 |
144.33 (-2.28%) |
147.70 |
143.62 - 149.90 |
0.4813 times |
Fri 03 October 2025 |
147.70 (1.24%) |
146.78 |
142.00 - 152.00 |
0.6028 times |
Fri 26 September 2025 |
145.89 (-10.9%) |
161.01 |
144.62 - 162.60 |
1.1787 times |
Fri 19 September 2025 |
163.74 (13.03%) |
145.89 |
143.51 - 168.30 |
4.9592 times |
Fri 12 September 2025 |
144.86 (-0.39%) |
146.40 |
139.55 - 154.09 |
0.892 times |
Fri 05 September 2025 |
145.43 (2.18%) |
142.00 |
141.49 - 152.40 |
0.6648 times |
Fri 29 August 2025 |
142.33 (-1.18%) |
144.77 |
142.00 - 146.79 |
0.3431 times |
Fri 22 August 2025 |
144.03 (5.32%) |
139.50 |
137.86 - 151.92 |
0.8012 times |
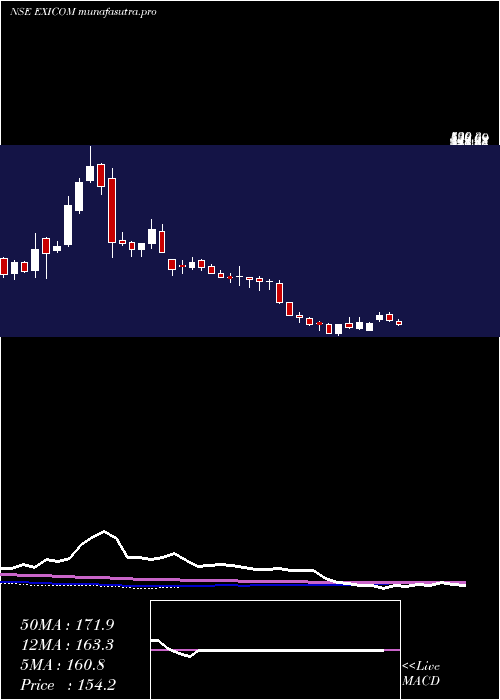
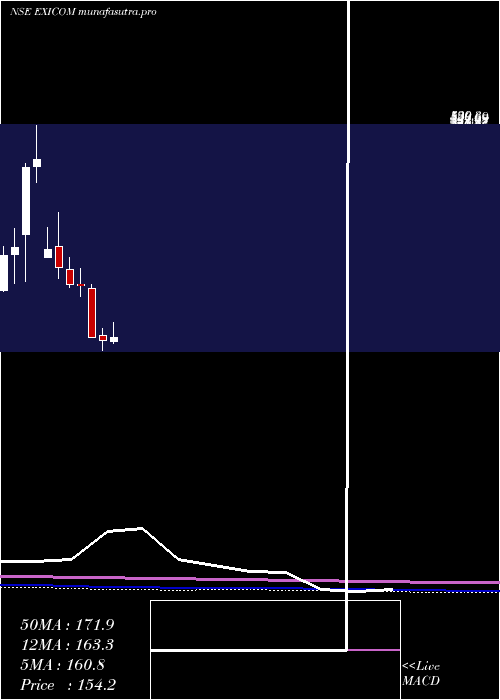
Monthly price and charts ExicomTele Strong monthly Stock price targets for ExicomTele EXICOM are 131.81 and 145.81 | Monthly Target 1 | 129.2 | | Monthly Target 2 | 134.41 | | Monthly Target 3 | 143.20333333333 | | Monthly Target 4 | 148.41 | | Monthly Target 5 | 157.2 |
Monthly price and volumes Exicom Tele
| Date |
Closing |
Open |
Range |
Volume |
Wed 29 October 2025 |
139.61 (-3.24%) |
144.30 |
138.00 - 152.00 |
0.3776 times |
Tue 30 September 2025 |
144.29 (1.38%) |
142.00 |
139.55 - 168.30 |
1.782 times |
Fri 29 August 2025 |
142.33 (-14.42%) |
167.00 |
135.00 - 167.49 |
0.7277 times |
Thu 31 July 2025 |
166.31 (-15.75%) |
198.80 |
161.31 - 207.39 |
0.9028 times |
Mon 30 June 2025 |
197.41 (10.15%) |
177.25 |
174.97 - 217.00 |
1.9276 times |
Fri 30 May 2025 |
179.22 (16.25%) |
154.17 |
141.00 - 194.00 |
0.8432 times |
Wed 30 April 2025 |
154.17 (4.56%) |
146.00 |
141.86 - 179.50 |
0.7504 times |
Fri 28 March 2025 |
147.44 (-3.9%) |
156.99 |
130.37 - 169.68 |
1.0776 times |
Fri 28 February 2025 |
153.43 (-37.38%) |
239.91 |
152.70 - 247.43 |
0.8537 times |
Fri 31 January 2025 |
245.01 (-0.93%) |
247.00 |
226.63 - 275.71 |
0.7575 times |
Tue 31 December 2024 |
247.30 (-10.88%) |
274.65 |
242.40 - 295.35 |
0.5179 times |
DMA SMA EMA moving averages of Exicom Tele EXICOM
DMA (daily moving average) of Exicom Tele EXICOM
| DMA period | DMA value | | 5 day DMA | 139.9 | | 12 day DMA | 140.8 | | 20 day DMA | 142.7 | | 35 day DMA | 144.93 | | 50 day DMA | 144.85 | | 100 day DMA | 160.36 | | 150 day DMA | 162.39 | | 200 day DMA | 170.73 | EMA (exponential moving average) of Exicom Tele EXICOM
| EMA period | EMA current | EMA prev | EMA prev2 | | 5 day EMA | 139.76 | 139.84 | 140.25 | | 12 day EMA | 141.01 | 141.27 | 141.68 | | 20 day EMA | 142.21 | 142.48 | 142.84 | | 35 day EMA | 143.02 | 143.22 | 143.47 | | 50 day EMA | 143.92 | 144.1 | 144.31 |
SMA (simple moving average) of Exicom Tele EXICOM
| SMA period | SMA current | SMA prev | SMA prev2 | | 5 day SMA | 139.9 | 140.17 | 140.19 | | 12 day SMA | 140.8 | 141.19 | 141.62 | | 20 day SMA | 142.7 | 142.9 | 143.24 | | 35 day SMA | 144.93 | 145.09 | 145.27 | | 50 day SMA | 144.85 | 144.79 | 144.81 | | 100 day SMA | 160.36 | 160.81 | 161.25 | | 150 day SMA | 162.39 | 162.44 | 162.47 | | 200 day SMA | 170.73 | 171.23 | 171.73 |
|
|
