EverestIndustries EVERESTIND_BE full analysis,charts,indicators,moving averages,SMA,DMA,EMA,ADX,MACD,RSIEverest Industries EVERESTIND_BE WideScreen charts, DMA,SMA,EMA technical analysis, forecast prediction, by indicators ADX,MACD,RSI,CCI NSE stock exchange
Daily price and charts and targets EverestIndustries Strong Daily Stock price targets for EverestIndustries EVERESTIND_BE are 548.5 and 557.45 | Daily Target 1 | 546.02 | | Daily Target 2 | 550.98 | | Daily Target 3 | 554.96666666667 | | Daily Target 4 | 559.93 | | Daily Target 5 | 563.92 |
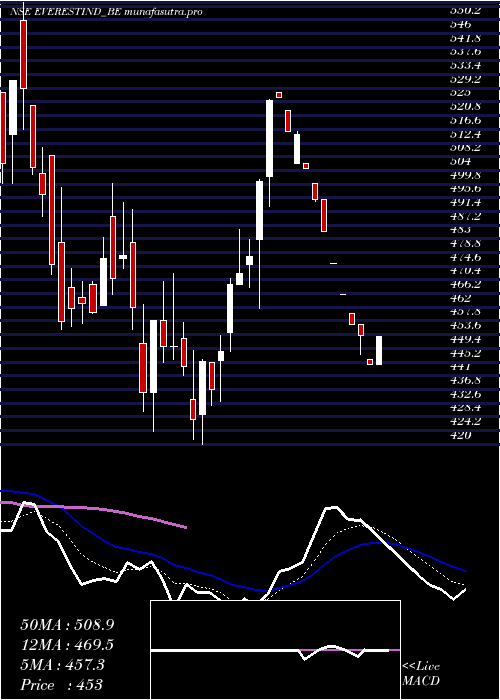
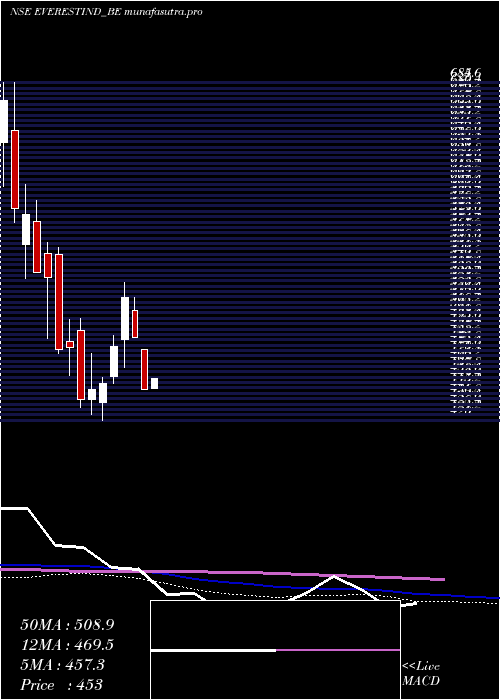
Daily price and volume Everest Industries
| Date |
Closing |
Open |
Range |
Volume |
Mon 14 July 2025 |
555.95 (1.45%) |
558.95 |
550.00 - 558.95 |
0.463 times |
Fri 11 July 2025 |
548.00 (-1.25%) |
554.50 |
545.00 - 554.50 |
0.2145 times |
Thu 10 July 2025 |
554.95 (-0.01%) |
562.00 |
554.95 - 562.00 |
0.5012 times |
Wed 09 July 2025 |
555.00 (0%) |
564.95 |
555.00 - 564.95 |
0.2666 times |
Tue 08 July 2025 |
555.00 (-0.54%) |
555.00 |
555.00 - 561.00 |
1.4559 times |
Mon 07 July 2025 |
558.00 (-1.24%) |
562.15 |
558.00 - 562.15 |
0.0673 times |
Fri 04 July 2025 |
565.00 (0.36%) |
563.00 |
555.05 - 565.00 |
1.2374 times |
Thu 03 July 2025 |
563.00 (-1.91%) |
573.95 |
562.90 - 573.95 |
0.4154 times |
Wed 02 July 2025 |
573.95 (0.69%) |
567.90 |
567.90 - 575.00 |
1.1142 times |
Tue 01 July 2025 |
570.00 (1.74%) |
554.00 |
552.55 - 570.00 |
4.2646 times |
Mon 30 June 2025 |
560.25 (1.99%) |
540.10 |
540.10 - 560.25 |
0.5482 times |
Weekly price and charts EverestIndustries Strong weekly Stock price targets for EverestIndustries EVERESTIND_BE are 548.5 and 557.45 | Weekly Target 1 | 546.02 | | Weekly Target 2 | 550.98 | | Weekly Target 3 | 554.96666666667 | | Weekly Target 4 | 559.93 | | Weekly Target 5 | 563.92 |
Weekly price and volumes for Everest Industries
| Date |
Closing |
Open |
Range |
Volume |
Mon 14 July 2025 |
555.95 (1.45%) |
558.95 |
550.00 - 558.95 |
0.0824 times |
Fri 11 July 2025 |
548.00 (-3.01%) |
562.15 |
545.00 - 564.95 |
0.446 times |
Fri 04 July 2025 |
565.00 (2.86%) |
540.10 |
540.10 - 575.00 |
1.3493 times |
Fri 27 June 2025 |
549.30 (6.6%) |
505.00 |
505.00 - 549.30 |
1.0602 times |
Fri 20 June 2025 |
515.30 (-5.91%) |
536.70 |
495.10 - 536.70 |
1.2733 times |
Fri 13 June 2025 |
547.65 (19.09%) |
482.80 |
463.05 - 558.80 |
1.6002 times |
Fri 06 June 2025 |
459.85 (-6.15%) |
497.80 |
440.70 - 497.85 |
2.7957 times |
Fri 30 May 2025 |
490.00 (-7.54%) |
529.95 |
487.05 - 529.95 |
0.3822 times |
Fri 23 May 2025 |
529.95 (8.47%) |
488.55 |
488.55 - 532.40 |
0.6228 times |
Fri 16 May 2025 |
488.55 (9.95%) |
444.50 |
444.50 - 488.55 |
0.3879 times |
Fri 09 May 2025 |
444.35 (-8.41%) |
475.45 |
444.35 - 475.45 |
0.3418 times |
Monthly price and charts EverestIndustries Strong monthly Stock price targets for EverestIndustries EVERESTIND_BE are 550.48 and 580.48 | Monthly Target 1 | 528.65 | | Monthly Target 2 | 542.3 | | Monthly Target 3 | 558.65 | | Monthly Target 4 | 572.3 | | Monthly Target 5 | 588.65 |
Monthly price and volumes Everest Industries
| Date |
Closing |
Open |
Range |
Volume |
Mon 14 July 2025 |
555.95 (-0.77%) |
554.00 |
545.00 - 575.00 |
0.3379 times |
Mon 30 June 2025 |
560.25 (14.34%) |
497.80 |
440.70 - 560.25 |
1.2959 times |
Fri 30 May 2025 |
490.00 (-1.02%) |
495.00 |
444.35 - 532.40 |
0.3391 times |
Wed 30 April 2025 |
495.05 (13.54%) |
436.00 |
420.00 - 528.00 |
1.0682 times |
Fri 28 March 2025 |
436.00 (-18.61%) |
551.00 |
430.00 - 559.00 |
2.3892 times |
Fri 28 February 2025 |
535.70 (-15.62%) |
638.00 |
531.00 - 685.00 |
1.4917 times |
Fri 31 January 2025 |
634.90 (0%) |
580.00 |
575.00 - 640.00 |
0.0779 times |
Mon 14 July 2025 |
(0%) |
|
- |
0 times |

DMA SMA EMA moving averages of Everest Industries EVERESTIND_BE
DMA (daily moving average) of Everest Industries EVERESTIND_BE
| DMA period | DMA value | | 5 day DMA | 553.78 | | 12 day DMA | 559.03 | | 20 day DMA | 544.5 | | 35 day DMA | 525.77 | | 50 day DMA | 513.06 | | 100 day DMA | 507.85 | | 150 day DMA | | | 200 day DMA | | EMA (exponential moving average) of Everest Industries EVERESTIND_BE
| EMA period | EMA current | EMA prev | EMA prev2 | | 5 day EMA | 554.52 | 553.8 | 556.7 | | 12 day EMA | 552.27 | 551.6 | 552.26 | | 20 day EMA | 544.95 | 543.79 | 543.35 | | 35 day EMA | 530.95 | 529.48 | 528.39 | | 50 day EMA | 515.63 | 513.98 | 512.59 |
SMA (simple moving average) of Everest Industries EVERESTIND_BE
| SMA period | SMA current | SMA prev | SMA prev2 | | 5 day SMA | 553.78 | 554.19 | 557.59 | | 12 day SMA | 559.03 | 557.58 | 555.92 | | 20 day SMA | 544.5 | 543.54 | 543.52 | | 35 day SMA | 525.77 | 524.73 | 524.21 | | 50 day SMA | 513.06 | 511.45 | 510.19 | | 100 day SMA | 507.85 | 508.57 | 509.67 | | 150 day SMA | | 200 day SMA |
|
|
