EverestIndustries EVERESTIND full analysis,charts,indicators,moving averages,SMA,DMA,EMA,ADX,MACD,RSIEverest Industries EVERESTIND WideScreen charts, DMA,SMA,EMA technical analysis, forecast prediction, by indicators ADX,MACD,RSI,CCI NSE stock exchange
operates under Cement & Cement Products sector
Daily price and charts and targets EverestIndustries Strong Daily Stock price targets for EverestIndustries EVERESTIND are 562.5 and 614.6 | Daily Target 1 | 551.32 | | Daily Target 2 | 573.68 | | Daily Target 3 | 603.41666666667 | | Daily Target 4 | 625.78 | | Daily Target 5 | 655.52 |
Daily price and volume Everest Industries
| Date |
Closing |
Open |
Range |
Volume |
Tue 28 October 2025 |
596.05 (-3.2%) |
615.75 |
581.05 - 633.15 |
2.8983 times |
Mon 27 October 2025 |
615.75 (-3.93%) |
640.95 |
614.10 - 642.80 |
1.3971 times |
Fri 24 October 2025 |
640.95 (-3.21%) |
662.35 |
630.10 - 662.85 |
1.3087 times |
Thu 23 October 2025 |
662.20 (1.21%) |
657.70 |
648.40 - 669.50 |
0.4196 times |
Tue 21 October 2025 |
654.30 (0.13%) |
660.00 |
654.00 - 663.95 |
0.2045 times |
Mon 20 October 2025 |
653.45 (-1.02%) |
660.25 |
643.00 - 663.10 |
0.4964 times |
Fri 17 October 2025 |
660.20 (-1.34%) |
670.65 |
658.00 - 674.15 |
0.6946 times |
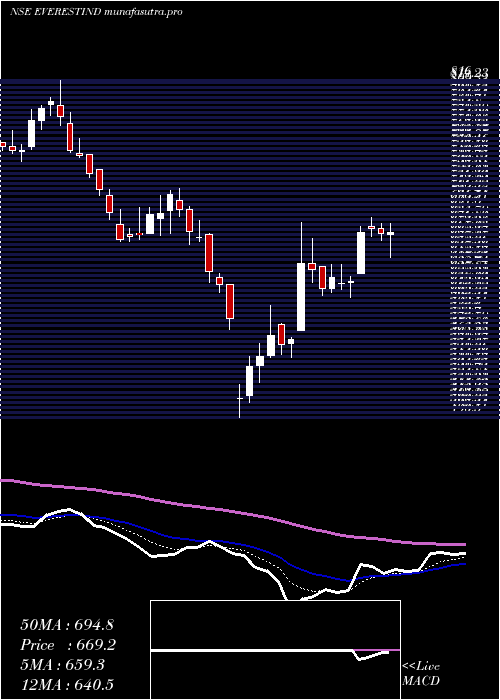
Thu 16 October 2025 |
669.20 (0.04%) |
668.80 |
666.00 - 678.90 |
0.6113 times |
Wed 15 October 2025 |
668.90 (0.59%) |
663.70 |
661.65 - 672.00 |
0.7819 times |
Tue 14 October 2025 |
665.00 (-0.2%) |
665.00 |
660.30 - 681.00 |
1.1877 times |
Mon 13 October 2025 |
666.35 (-1.87%) |
679.05 |
665.00 - 681.80 |
0.8659 times |
Weekly price and charts EverestIndustries Strong weekly Stock price targets for EverestIndustries EVERESTIND are 557.68 and 619.43 | Weekly Target 1 | 544.88 | | Weekly Target 2 | 570.47 | | Weekly Target 3 | 606.63333333333 | | Weekly Target 4 | 632.22 | | Weekly Target 5 | 668.38 |
Weekly price and volumes for Everest Industries
| Date |
Closing |
Open |
Range |
Volume |
Tue 28 October 2025 |
596.05 (-7.01%) |
640.95 |
581.05 - 642.80 |
0.6133 times |
Fri 24 October 2025 |
640.95 (-2.92%) |
660.25 |
630.10 - 669.50 |
0.3469 times |
Fri 17 October 2025 |
660.20 (-2.78%) |
679.05 |
658.00 - 681.80 |
0.5913 times |
Fri 10 October 2025 |
679.05 (-5%) |
714.80 |
666.85 - 717.00 |
1.0504 times |
Fri 03 October 2025 |
714.80 (5.09%) |
690.00 |
671.00 - 724.00 |
0.5793 times |
Fri 26 September 2025 |
680.20 (-1.3%) |
689.00 |
677.00 - 750.00 |
1.4384 times |
Fri 19 September 2025 |
689.15 (1.36%) |
680.00 |
658.65 - 742.50 |
1.7598 times |
Fri 12 September 2025 |
679.90 (2.06%) |
669.70 |
653.70 - 693.40 |
0.7372 times |
Fri 05 September 2025 |
666.20 (-0.45%) |
675.00 |
645.25 - 689.80 |
0.9133 times |
Fri 29 August 2025 |
669.20 (8.86%) |
614.75 |
606.40 - 674.90 |
1.9701 times |
Fri 22 August 2025 |
614.75 (7.96%) |
580.00 |
548.00 - 678.75 |
4.4735 times |

Monthly price and charts EverestIndustries Strong monthly Stock price targets for EverestIndustries EVERESTIND are 517.08 and 660.03 | Monthly Target 1 | 490.75 | | Monthly Target 2 | 543.4 | | Monthly Target 3 | 633.7 | | Monthly Target 4 | 686.35 | | Monthly Target 5 | 776.65 |
Monthly price and volumes Everest Industries
| Date |
Closing |
Open |
Range |
Volume |
Tue 28 October 2025 |
596.05 (-11.77%) |
671.00 |
581.05 - 724.00 |
0.5304 times |
Tue 30 September 2025 |
675.60 (0.96%) |
675.00 |
645.25 - 750.00 |
0.9079 times |
Fri 29 August 2025 |
669.20 (14.12%) |
508.70 |
490.50 - 678.75 |
1.4223 times |
Tue 28 January 2025 |
586.40 (-24.54%) |
777.10 |
575.00 - 816.00 |
0.8837 times |
Tue 31 December 2024 |
777.10 (-4.59%) |
813.10 |
737.55 - 834.35 |
0.8402 times |
Fri 29 November 2024 |
814.50 (-27.67%) |
1140.05 |
752.50 - 1150.00 |
2.0521 times |
Thu 31 October 2024 |
1126.10 (7.82%) |
1048.00 |
929.45 - 1189.95 |
0.8371 times |
Mon 30 September 2024 |
1044.40 (-7.69%) |
1117.10 |
1030.95 - 1172.15 |
0.7211 times |
Fri 30 August 2024 |
1131.35 (-5.89%) |
1220.25 |
1016.00 - 1265.20 |
1.1388 times |
Wed 31 July 2024 |
1202.20 (2.18%) |
1179.00 |
1128.50 - 1255.05 |
0.6663 times |
Fri 28 June 2024 |
1176.50 (5.95%) |
1130.00 |
935.80 - 1221.00 |
0.7867 times |

DMA SMA EMA moving averages of Everest Industries EVERESTIND
DMA (daily moving average) of Everest Industries EVERESTIND
| DMA period | DMA value | | 5 day DMA | 633.85 | | 12 day DMA | 652.62 | | 20 day DMA | 666.84 | | 35 day DMA | 674.34 | | 50 day DMA | 661.3 | | 100 day DMA | 698.89 | | 150 day DMA | 810.01 | | 200 day DMA | 894.66 | EMA (exponential moving average) of Everest Industries EVERESTIND
| EMA period | EMA current | EMA prev | EMA prev2 | | 5 day EMA | 626.24 | 641.34 | 654.13 | | 12 day EMA | 646.97 | 656.22 | 663.58 | | 20 day EMA | 656.13 | 662.45 | 667.36 | | 35 day EMA | 654.33 | 657.76 | 660.23 | | 50 day EMA | 650.09 | 652.29 | 653.78 |
SMA (simple moving average) of Everest Industries EVERESTIND
| SMA period | SMA current | SMA prev | SMA prev2 | | 5 day SMA | 633.85 | 645.33 | 654.22 | | 12 day SMA | 652.62 | 660.12 | 665.95 | | 20 day SMA | 666.84 | 671.05 | 675.96 | | 35 day SMA | 674.34 | 676.35 | 677.8 | | 50 day SMA | 661.3 | 660.37 | 658.84 | | 100 day SMA | 698.89 | 700.81 | 702.81 | | 150 day SMA | 810.01 | 813.51 | 816.93 | | 200 day SMA | 894.66 | 897.56 | 900.39 |
|
|
