EdelamcEsilver ESILVER full analysis,charts,indicators,moving averages,SMA,DMA,EMA,ADX,MACD,RSIEdelamc Esilver ESILVER WideScreen charts, DMA,SMA,EMA technical analysis, forecast prediction, by indicators ADX,MACD,RSI,CCI NSE stock exchange
Daily price and charts and targets EdelamcEsilver Strong Daily Stock price targets for EdelamcEsilver ESILVER are 144.62 and 151.5 | Daily Target 1 | 138.99 | | Daily Target 2 | 143.37 | | Daily Target 3 | 145.87333333333 | | Daily Target 4 | 150.25 | | Daily Target 5 | 152.75 |
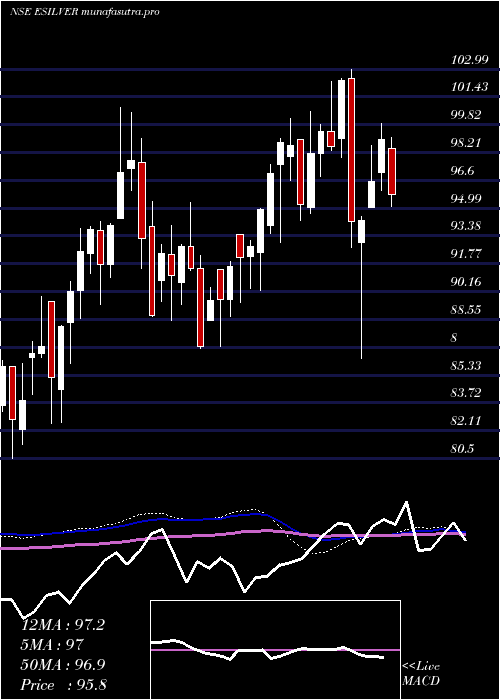
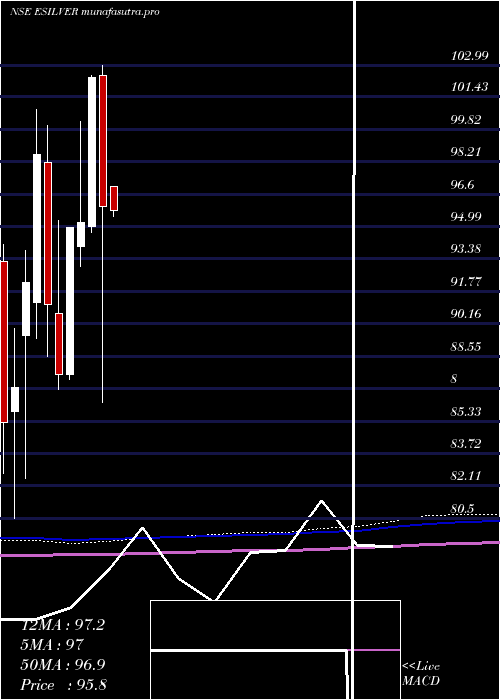
Daily price and volume Edelamc Esilver
| Date |
Closing |
Open |
Range |
Volume |
Wed 29 October 2025 |
147.74 (5.24%) |
141.50 |
141.50 - 148.38 |
1.9591 times |
Tue 28 October 2025 |
140.38 (-4.67%) |
146.00 |
139.33 - 146.00 |
0.3707 times |
Mon 27 October 2025 |
147.26 (-0.06%) |
149.00 |
143.30 - 151.88 |
0.4154 times |
Fri 24 October 2025 |
147.35 (-1.69%) |
149.00 |
143.26 - 149.88 |
0.5701 times |
Thu 23 October 2025 |
149.89 (-1.21%) |
150.68 |
141.26 - 151.00 |
3.1664 times |
Tue 21 October 2025 |
151.72 (-3.22%) |
161.47 |
150.10 - 161.48 |
0.0973 times |
Mon 20 October 2025 |
156.77 (-6.45%) |
163.70 |
151.30 - 163.70 |
1.0387 times |
Fri 17 October 2025 |
167.57 (-0.68%) |
170.00 |
160.00 - 174.31 |
0.569 times |
Thu 16 October 2025 |
168.71 (-7.53%) |
179.80 |
165.33 - 186.60 |
1.0453 times |
Wed 15 October 2025 |
182.45 (-1.83%) |
189.00 |
178.10 - 191.94 |
0.768 times |
Tue 14 October 2025 |
185.85 (6.15%) |
177.00 |
175.95 - 192.00 |
1.3931 times |

Weekly price and charts EdelamcEsilver Strong weekly Stock price targets for EdelamcEsilver ESILVER are 137.26 and 149.81 | Weekly Target 1 | 133.77 | | Weekly Target 2 | 140.75 | | Weekly Target 3 | 146.31666666667 | | Weekly Target 4 | 153.3 | | Weekly Target 5 | 158.87 |
Weekly price and volumes for Edelamc Esilver
| Date |
Closing |
Open |
Range |
Volume |
Wed 29 October 2025 |
147.74 (0.26%) |
149.00 |
139.33 - 151.88 |
0.4667 times |
Fri 24 October 2025 |
147.35 (-12.07%) |
163.70 |
141.26 - 163.70 |
0.8284 times |
Fri 17 October 2025 |
167.57 (2.75%) |
163.09 |
160.00 - 192.00 |
0.9454 times |
Fri 10 October 2025 |
163.09 (11.97%) |
148.00 |
148.00 - 165.27 |
1.4355 times |
Fri 03 October 2025 |
145.65 (4.78%) |
142.50 |
141.00 - 148.00 |
1.2188 times |
Fri 26 September 2025 |
139.00 (7.51%) |
131.88 |
131.30 - 148.05 |
1.5085 times |
Fri 19 September 2025 |
129.29 (0.23%) |
129.48 |
126.00 - 130.40 |
0.8527 times |
Fri 12 September 2025 |
128.99 (3.69%) |
125.50 |
123.58 - 144.85 |
1.3258 times |
Fri 05 September 2025 |
124.40 (4.8%) |
119.99 |
119.99 - 148.00 |
0.9475 times |
Fri 29 August 2025 |
118.70 (3.27%) |
116.50 |
116.02 - 119.80 |
0.4707 times |
Fri 22 August 2025 |
114.94 (-0.89%) |
115.49 |
111.70 - 115.50 |
0.469 times |
Monthly price and charts EdelamcEsilver Strong monthly Stock price targets for EdelamcEsilver ESILVER are 143.54 and 196.21 | Monthly Target 1 | 107.02 | | Monthly Target 2 | 127.38 | | Monthly Target 3 | 159.69 | | Monthly Target 4 | 180.05 | | Monthly Target 5 | 212.36 |
Monthly price and volumes Edelamc Esilver
| Date |
Closing |
Open |
Range |
Volume |
Wed 29 October 2025 |
147.74 (3.9%) |
145.09 |
139.33 - 192.00 |
2.4293 times |
Tue 30 September 2025 |
142.20 (19.8%) |
119.99 |
119.99 - 148.05 |
2.5443 times |
Fri 29 August 2025 |
118.70 (6.09%) |
111.89 |
107.19 - 119.80 |
1.0142 times |
Thu 31 July 2025 |
111.89 (4.58%) |
107.28 |
106.21 - 117.10 |
1.0316 times |
Mon 30 June 2025 |
106.99 (8.25%) |
99.33 |
98.05 - 111.00 |
0.5198 times |
Fri 30 May 2025 |
98.84 (2.98%) |
96.98 |
94.37 - 100.18 |
0.4548 times |
Wed 30 April 2025 |
95.98 (-6.26%) |
102.48 |
86.27 - 102.99 |
0.5302 times |
Fri 28 March 2025 |
102.39 (7.56%) |
95.01 |
94.70 - 102.51 |
0.5064 times |
Fri 28 February 2025 |
95.19 (0.27%) |
93.99 |
93.00 - 100.20 |
0.4933 times |
Fri 31 January 2025 |
94.93 (8.32%) |
87.64 |
87.37 - 94.95 |
0.4763 times |
Tue 31 December 2024 |
87.64 (-3.79%) |
90.68 |
86.89 - 95.30 |
0.3313 times |
DMA SMA EMA moving averages of Edelamc Esilver ESILVER
DMA (daily moving average) of Edelamc Esilver ESILVER
| DMA period | DMA value | | 5 day DMA | 146.52 | | 12 day DMA | 160.06 | | 20 day DMA | 156.7 | | 35 day DMA | 146.03 | | 50 day DMA | 137.95 | | 100 day DMA | 124.55 | | 150 day DMA | 115.65 | | 200 day DMA | 110.67 | EMA (exponential moving average) of Edelamc Esilver ESILVER
| EMA period | EMA current | EMA prev | EMA prev2 | | 5 day EMA | 147.93 | 148.03 | 151.85 | | 12 day EMA | 152.57 | 153.45 | 155.83 | | 20 day EMA | 151.85 | 152.28 | 153.53 | | 35 day EMA | 145.91 | 145.8 | 146.12 | | 50 day EMA | 136.95 | 136.51 | 136.35 |
SMA (simple moving average) of Edelamc Esilver ESILVER
| SMA period | SMA current | SMA prev | SMA prev2 | | 5 day SMA | 146.52 | 147.32 | 150.6 | | 12 day SMA | 160.06 | 161.34 | 163.11 | | 20 day SMA | 156.7 | 156.58 | 156.52 | | 35 day SMA | 146.03 | 145.42 | 144.97 | | 50 day SMA | 137.95 | 137.31 | 136.83 | | 100 day SMA | 124.55 | 124.12 | 123.74 | | 150 day SMA | 115.65 | 115.34 | 115.07 | | 200 day SMA | 110.67 | 110.39 | 110.13 |
|
|
