MiraeamcMaesgetf ESG full analysis,charts,indicators,moving averages,SMA,DMA,EMA,ADX,MACD,RSIMiraeamc Maesgetf ESG WideScreen charts, DMA,SMA,EMA technical analysis, forecast prediction, by indicators ADX,MACD,RSI,CCI NSE stock exchange
Daily price and charts and targets MiraeamcMaesgetf Strong Daily Stock price targets for MiraeamcMaesgetf ESG are 43.65 and 44.09 | Daily Target 1 | 43.54 | | Daily Target 2 | 43.76 | | Daily Target 3 | 43.983333333333 | | Daily Target 4 | 44.2 | | Daily Target 5 | 44.42 |
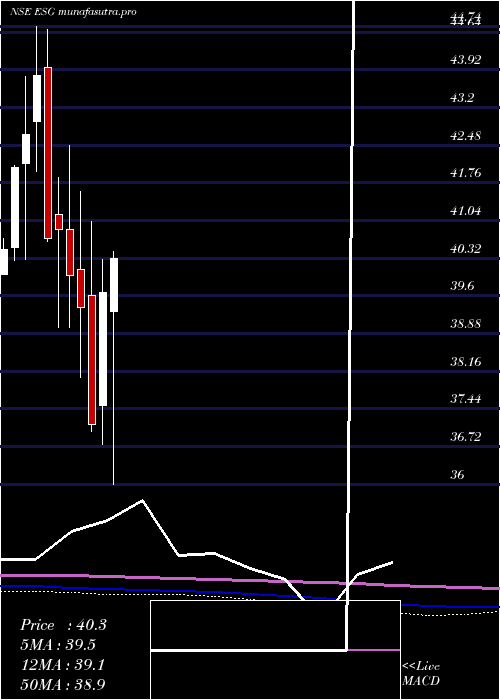
Daily price and volume Miraeamc Maesgetf
| Date |
Closing |
Open |
Range |
Volume |
Tue 28 October 2025 |
43.97 (-0.23%) |
44.21 |
43.77 - 44.21 |
0.1482 times |
Mon 27 October 2025 |
44.07 (0.89%) |
43.99 |
43.89 - 44.10 |
0.4715 times |
Fri 24 October 2025 |
43.68 (-0.64%) |
44.00 |
43.59 - 44.02 |
4.002 times |
Thu 23 October 2025 |
43.96 (0.21%) |
43.50 |
42.91 - 44.31 |
2.1167 times |
Tue 21 October 2025 |
43.87 (-0.02%) |
43.95 |
43.59 - 44.04 |
0.1803 times |
Mon 20 October 2025 |
43.88 (0.48%) |
43.67 |
43.67 - 44.00 |
0.2866 times |
Fri 17 October 2025 |
43.67 (0.55%) |
43.64 |
43.36 - 43.82 |
1.0799 times |
Thu 16 October 2025 |
43.43 (0.51%) |
43.14 |
43.14 - 43.53 |
0.6054 times |
Wed 15 October 2025 |
43.21 (1.12%) |
42.98 |
42.74 - 43.22 |
0.1005 times |
Tue 14 October 2025 |
42.73 (-0.4%) |
43.11 |
42.39 - 43.23 |
1.0089 times |
Mon 13 October 2025 |
42.90 (-0.21%) |
42.01 |
42.01 - 43.03 |
0.1452 times |

Weekly price and charts MiraeamcMaesgetf Strong weekly Stock price targets for MiraeamcMaesgetf ESG are 43.65 and 44.09 | Weekly Target 1 | 43.54 | | Weekly Target 2 | 43.76 | | Weekly Target 3 | 43.983333333333 | | Weekly Target 4 | 44.2 | | Weekly Target 5 | 44.42 |
Weekly price and volumes for Miraeamc Maesgetf
| Date |
Closing |
Open |
Range |
Volume |
Tue 28 October 2025 |
43.97 (0.66%) |
43.99 |
43.77 - 44.21 |
0.3092 times |
Fri 24 October 2025 |
43.68 (0.02%) |
43.67 |
42.91 - 44.31 |
3.2852 times |
Fri 17 October 2025 |
43.67 (1.58%) |
42.01 |
42.01 - 43.82 |
1.4665 times |
Fri 10 October 2025 |
42.99 (1.61%) |
42.52 |
42.31 - 43.20 |
0.5855 times |
Fri 03 October 2025 |
42.31 (0.67%) |
42.15 |
41.16 - 43.23 |
0.4416 times |
Fri 26 September 2025 |
42.03 (-3.27%) |
43.34 |
41.95 - 44.53 |
1.2643 times |
Fri 19 September 2025 |
43.45 (0.67%) |
43.37 |
42.98 - 43.75 |
0.6321 times |
Fri 12 September 2025 |
43.16 (1.39%) |
42.50 |
42.50 - 43.20 |
0.6343 times |
Fri 05 September 2025 |
42.57 (1.48%) |
42.99 |
41.98 - 42.99 |
0.3244 times |
Fri 29 August 2025 |
41.95 (-1.78%) |
42.85 |
41.92 - 43.10 |
1.0568 times |
Fri 22 August 2025 |
42.71 (1.52%) |
41.01 |
41.01 - 43.69 |
1.9788 times |

Monthly price and charts MiraeamcMaesgetf Strong monthly Stock price targets for MiraeamcMaesgetf ESG are 42.57 and 45.72 | Monthly Target 1 | 40 | | Monthly Target 2 | 41.98 | | Monthly Target 3 | 43.146666666667 | | Monthly Target 4 | 45.13 | | Monthly Target 5 | 46.3 |
Monthly price and volumes Miraeamc Maesgetf
| Date |
Closing |
Open |
Range |
Volume |
Tue 28 October 2025 |
43.97 (4.67%) |
41.16 |
41.16 - 44.31 |
1.4605 times |
Tue 30 September 2025 |
42.01 (0.14%) |
42.99 |
41.94 - 44.53 |
0.7072 times |
Fri 29 August 2025 |
41.95 (-1.08%) |
42.98 |
41.01 - 43.69 |
0.8408 times |
Thu 31 July 2025 |
42.41 (-2.1%) |
43.00 |
41.69 - 44.48 |
1.7499 times |
Mon 30 June 2025 |
43.32 (3.02%) |
42.05 |
40.88 - 44.00 |
0.9829 times |
Fri 30 May 2025 |
42.05 (2.16%) |
41.29 |
39.08 - 42.55 |
0.9073 times |
Wed 30 April 2025 |
41.16 (3.76%) |
39.30 |
36.00 - 41.52 |
0.4558 times |
Fri 28 March 2025 |
39.67 (6.81%) |
37.50 |
36.76 - 40.30 |
0.6194 times |
Fri 28 February 2025 |
37.14 (-5.66%) |
39.60 |
37.00 - 41.02 |
0.9383 times |
Fri 31 January 2025 |
39.37 (-1.53%) |
40.11 |
38.03 - 41.60 |
1.338 times |
Tue 31 December 2024 |
39.98 (-2.15%) |
40.87 |
39.00 - 42.48 |
1.5136 times |
DMA SMA EMA moving averages of Miraeamc Maesgetf ESG
DMA (daily moving average) of Miraeamc Maesgetf ESG
| DMA period | DMA value | | 5 day DMA | 43.91 | | 12 day DMA | 43.53 | | 20 day DMA | 43.11 | | 35 day DMA | 43.06 | | 50 day DMA | 42.9 | | 100 day DMA | 42.74 | | 150 day DMA | 42.07 | | 200 day DMA | 41.2 | EMA (exponential moving average) of Miraeamc Maesgetf ESG
| EMA period | EMA current | EMA prev | EMA prev2 | | 5 day EMA | 43.88 | 43.83 | 43.71 | | 12 day EMA | 43.6 | 43.53 | 43.43 | | 20 day EMA | 43.35 | 43.29 | 43.21 | | 35 day EMA | 43.1 | 43.05 | 42.99 | | 50 day EMA | 42.92 | 42.88 | 42.83 |
SMA (simple moving average) of Miraeamc Maesgetf ESG
| SMA period | SMA current | SMA prev | SMA prev2 | | 5 day SMA | 43.91 | 43.89 | 43.81 | | 12 day SMA | 43.53 | 43.45 | 43.33 | | 20 day SMA | 43.11 | 43.01 | 42.93 | | 35 day SMA | 43.06 | 43.02 | 42.98 | | 50 day SMA | 42.9 | 42.87 | 42.82 | | 100 day SMA | 42.74 | 42.72 | 42.7 | | 150 day SMA | 42.07 | 42.04 | 42 | | 200 day SMA | 41.2 | 41.18 | 41.16 |
|
|
