Epigral EPIGRAL full analysis,charts,indicators,moving averages,SMA,DMA,EMA,ADX,MACD,RSIEpigral EPIGRAL WideScreen charts, DMA,SMA,EMA technical analysis, forecast prediction, by indicators ADX,MACD,RSI,CCI NSE stock exchange
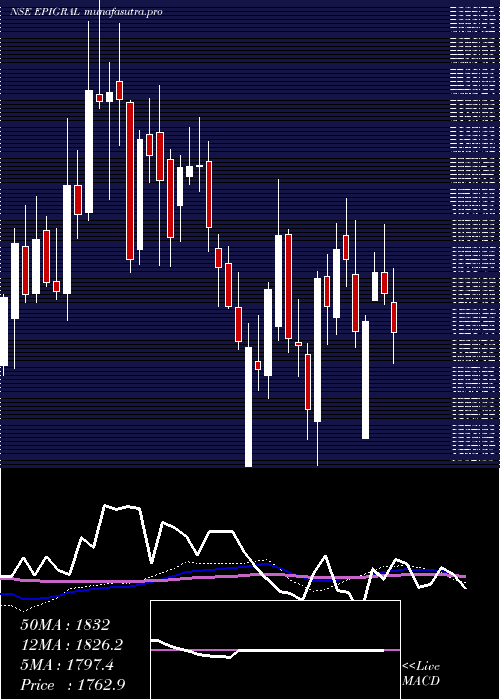
Daily price and charts and targets Epigral Strong Daily Stock price targets for Epigral EPIGRAL are 1701.4 and 1735 | Daily Target 1 | 1677.3 | | Daily Target 2 | 1691.9 | | Daily Target 3 | 1710.9 | | Daily Target 4 | 1725.5 | | Daily Target 5 | 1744.5 |
Daily price and volume Epigral
| Date |
Closing |
Open |
Range |
Volume |
Wed 29 October 2025 |
1706.50 (0.52%) |
1698.90 |
1696.30 - 1729.90 |
1.9736 times |
Tue 28 October 2025 |
1697.60 (0.03%) |
1699.50 |
1692.50 - 1708.90 |
0.508 times |
Mon 27 October 2025 |
1697.10 (-0.51%) |
1705.80 |
1694.00 - 1724.50 |
0.7246 times |
Fri 24 October 2025 |
1705.80 (0.29%) |
1701.00 |
1691.30 - 1720.00 |
0.8637 times |
Thu 23 October 2025 |
1700.80 (-0.22%) |
1705.10 |
1696.00 - 1722.70 |
1.3386 times |
Tue 21 October 2025 |
1704.50 (1.09%) |
1720.00 |
1696.40 - 1720.00 |
0.339 times |
Mon 20 October 2025 |
1686.10 (-0.85%) |
1708.00 |
1680.00 - 1710.00 |
1.3501 times |
Fri 17 October 2025 |
1700.60 (-0.09%) |
1702.10 |
1691.00 - 1717.00 |
0.6585 times |
Thu 16 October 2025 |
1702.10 (1.92%) |
1665.40 |
1665.40 - 1710.00 |
0.921 times |
Wed 15 October 2025 |
1670.00 (-0.94%) |
1682.90 |
1661.00 - 1690.30 |
1.323 times |
Tue 14 October 2025 |
1685.80 (-1.2%) |
1706.30 |
1680.00 - 1716.40 |
0.9549 times |
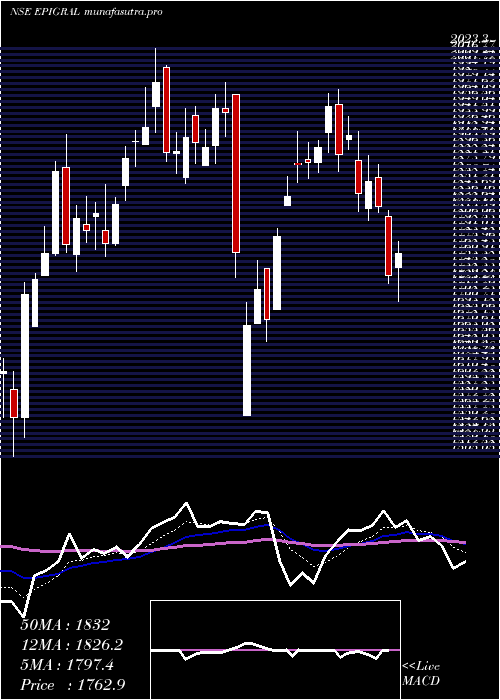
Weekly price and charts Epigral Strong weekly Stock price targets for Epigral EPIGRAL are 1699.5 and 1736.9 | Weekly Target 1 | 1672.23 | | Weekly Target 2 | 1689.37 | | Weekly Target 3 | 1709.6333333333 | | Weekly Target 4 | 1726.77 | | Weekly Target 5 | 1747.03 |
Weekly price and volumes for Epigral
| Date |
Closing |
Open |
Range |
Volume |
Wed 29 October 2025 |
1706.50 (0.04%) |
1705.80 |
1692.50 - 1729.90 |
0.4343 times |
Fri 24 October 2025 |
1705.80 (0.31%) |
1708.00 |
1680.00 - 1722.70 |
0.5271 times |
Fri 17 October 2025 |
1700.60 (-0.89%) |
1700.00 |
1661.00 - 1721.00 |
0.7921 times |
Fri 10 October 2025 |
1715.90 (-2.16%) |
1753.70 |
1703.00 - 1759.70 |
0.6882 times |
Fri 03 October 2025 |
1753.70 (5.7%) |
1652.00 |
1639.10 - 1771.00 |
1.3077 times |
Fri 26 September 2025 |
1659.20 (-5.9%) |
1760.20 |
1651.20 - 1771.00 |
1.3248 times |
Fri 19 September 2025 |
1763.20 (-1.3%) |
1786.40 |
1749.90 - 1808.80 |
1.3829 times |
Fri 12 September 2025 |
1786.40 (1.46%) |
1760.00 |
1749.40 - 1808.80 |
1.1546 times |
Fri 05 September 2025 |
1760.70 (-2.8%) |
1808.00 |
1746.10 - 1831.80 |
1.0519 times |
Fri 29 August 2025 |
1811.40 (-1.84%) |
1850.00 |
1771.60 - 1850.00 |
1.3363 times |
Fri 22 August 2025 |
1845.30 (-1.22%) |
1889.00 |
1841.20 - 1911.60 |
1.7863 times |
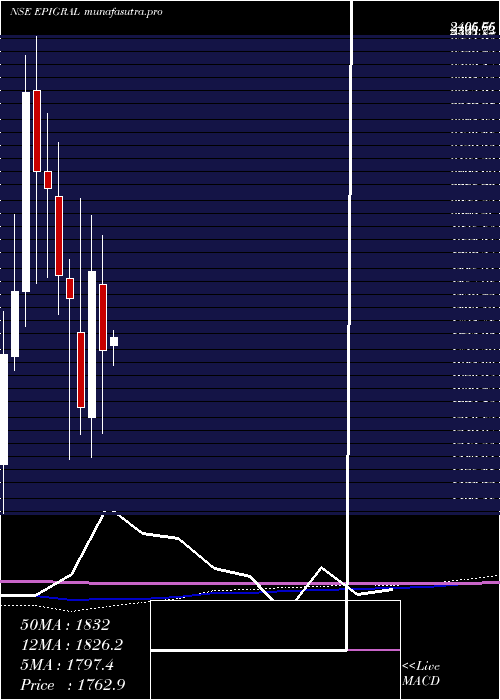
Monthly price and charts Epigral Strong monthly Stock price targets for Epigral EPIGRAL are 1683.75 and 1793.75 | Monthly Target 1 | 1602.83 | | Monthly Target 2 | 1654.67 | | Monthly Target 3 | 1712.8333333333 | | Monthly Target 4 | 1764.67 | | Monthly Target 5 | 1822.83 |
Monthly price and volumes Epigral
| Date |
Closing |
Open |
Range |
Volume |
Wed 29 October 2025 |
1706.50 (0.91%) |
1691.10 |
1661.00 - 1771.00 |
0.2208 times |
Tue 30 September 2025 |
1691.10 (-6.64%) |
1808.00 |
1639.10 - 1831.80 |
0.4556 times |
Fri 29 August 2025 |
1811.40 (-10.29%) |
2015.00 |
1771.60 - 2052.00 |
0.8842 times |
Thu 31 July 2025 |
2019.20 (11.67%) |
1814.90 |
1683.40 - 2114.00 |
2.0718 times |
Mon 30 June 2025 |
1808.20 (1.58%) |
1797.90 |
1700.40 - 1888.90 |
0.6701 times |
Fri 30 May 2025 |
1780.10 (2.59%) |
1745.00 |
1701.90 - 1990.00 |
1.1895 times |
Wed 30 April 2025 |
1735.20 (-8.87%) |
1875.55 |
1557.00 - 1980.00 |
0.867 times |
Fri 28 March 2025 |
1904.10 (18.02%) |
1590.40 |
1505.05 - 2023.30 |
0.8411 times |
Fri 28 February 2025 |
1613.35 (-12.62%) |
1773.25 |
1555.50 - 2060.00 |
1.0548 times |
Fri 31 January 2025 |
1846.40 (-2.63%) |
1888.35 |
1502.35 - 1930.00 |
1.745 times |
Tue 31 December 2024 |
1896.20 (-8.94%) |
2065.05 |
1812.60 - 2180.00 |
1.0372 times |
DMA SMA EMA moving averages of Epigral EPIGRAL
DMA (daily moving average) of Epigral EPIGRAL
| DMA period | DMA value | | 5 day DMA | 1701.56 | | 12 day DMA | 1696.93 | | 20 day DMA | 1707 | | 35 day DMA | 1726.38 | | 50 day DMA | 1754.55 | | 100 day DMA | 1788.71 | | 150 day DMA | 1805.52 | | 200 day DMA | 1798.4 | EMA (exponential moving average) of Epigral EPIGRAL
| EMA period | EMA current | EMA prev | EMA prev2 | | 5 day EMA | 1701.48 | 1698.97 | 1699.65 | | 12 day EMA | 1702.6 | 1701.89 | 1702.67 | | 20 day EMA | 1710.21 | 1710.6 | 1711.97 | | 35 day EMA | 1733.59 | 1735.18 | 1737.39 | | 50 day EMA | 1757.64 | 1759.73 | 1762.26 |
SMA (simple moving average) of Epigral EPIGRAL
| SMA period | SMA current | SMA prev | SMA prev2 | | 5 day SMA | 1701.56 | 1701.16 | 1698.86 | | 12 day SMA | 1696.93 | 1697.72 | 1698.98 | | 20 day SMA | 1707 | 1706.75 | 1704.83 | | 35 day SMA | 1726.38 | 1728.02 | 1729.82 | | 50 day SMA | 1754.55 | 1757.78 | 1761.12 | | 100 day SMA | 1788.71 | 1789.6 | 1790.38 | | 150 day SMA | 1805.52 | 1806.84 | 1808.08 | | 200 day SMA | 1798.4 | 1799.09 | 1799.35 |
|
|
