EnergyDeve ENERGYDEV_BE full analysis,charts,indicators,moving averages,SMA,DMA,EMA,ADX,MACD,RSIEnergy Deve ENERGYDEV_BE WideScreen charts, DMA,SMA,EMA technical analysis, forecast prediction, by indicators ADX,MACD,RSI,CCI NSE stock exchange
Daily price and charts and targets EnergyDeve Strong Daily Stock price targets for EnergyDeve ENERGYDEV_BE are 19.88 and 21.48 | Daily Target 1 | 18.58 | | Daily Target 2 | 19.57 | | Daily Target 3 | 20.183333333333 | | Daily Target 4 | 21.17 | | Daily Target 5 | 21.78 |
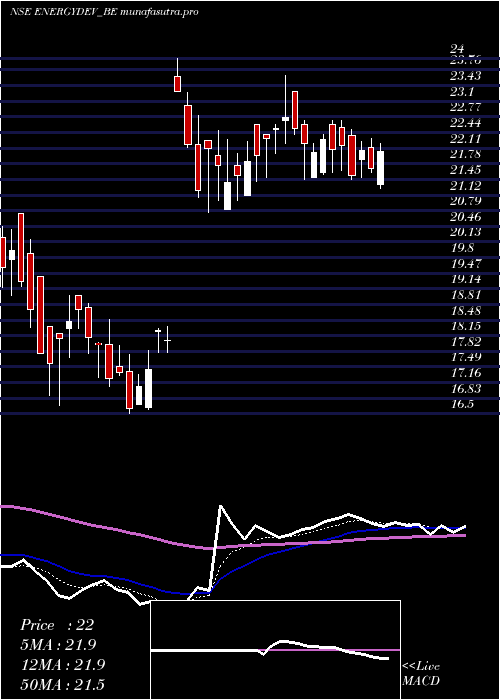
Daily price and volume Energy Deve
| Date |
Closing |
Open |
Range |
Volume |
Tue 09 December 2025 |
20.55 (2.54%) |
19.99 |
19.20 - 20.80 |
0.8973 times |
Mon 08 December 2025 |
20.04 (-2.15%) |
20.40 |
19.56 - 20.64 |
1.1648 times |
Fri 05 December 2025 |
20.48 (-1.59%) |
20.81 |
19.80 - 21.14 |
1.7556 times |
Thu 04 December 2025 |
20.81 (-3.92%) |
21.20 |
20.70 - 21.54 |
1.4242 times |
Wed 03 December 2025 |
21.66 (-3%) |
22.25 |
21.21 - 22.50 |
1.4038 times |
Tue 02 December 2025 |
22.33 (11.71%) |
22.90 |
21.89 - 23.50 |
1.4782 times |
Fri 19 September 2025 |
19.99 (0.35%) |
19.95 |
19.76 - 20.20 |
0.3814 times |
Thu 18 September 2025 |
19.92 (-0.35%) |
19.99 |
19.87 - 20.67 |
0.2039 times |
Wed 17 September 2025 |
19.99 (0.25%) |
20.05 |
19.72 - 20.45 |
0.4505 times |
Tue 16 September 2025 |
19.94 (0.45%) |
20.14 |
19.72 - 20.14 |
0.8404 times |
Mon 15 September 2025 |
19.85 (0%) |
19.86 |
19.61 - 20.15 |
0.3991 times |
Weekly price and charts EnergyDeve Strong weekly Stock price targets for EnergyDeve ENERGYDEV_BE are 19.88 and 21.48 | Weekly Target 1 | 18.58 | | Weekly Target 2 | 19.57 | | Weekly Target 3 | 20.183333333333 | | Weekly Target 4 | 21.17 | | Weekly Target 5 | 21.78 |
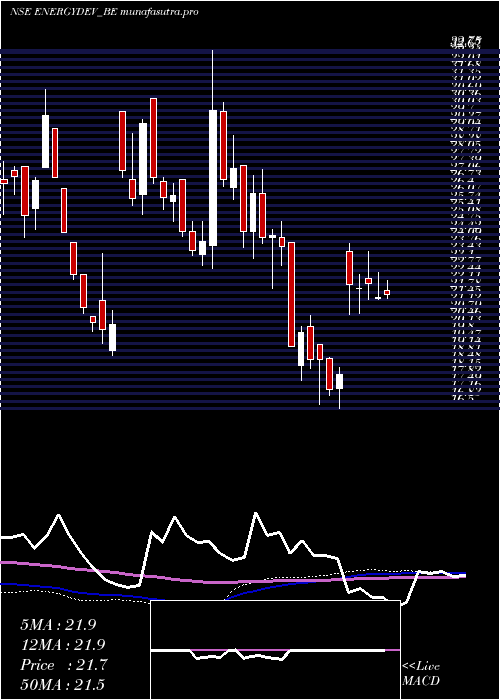
Weekly price and volumes for Energy Deve
| Date |
Closing |
Open |
Range |
Volume |
Tue 09 December 2025 |
20.55 (0.34%) |
20.40 |
19.20 - 20.80 |
0.8083 times |
Fri 05 December 2025 |
20.48 (2.45%) |
22.90 |
19.80 - 23.50 |
2.3761 times |
Fri 19 September 2025 |
19.99 (0.71%) |
19.86 |
19.61 - 20.67 |
0.8919 times |
Fri 12 September 2025 |
19.85 (-0.7%) |
19.21 |
19.21 - 20.90 |
0.4458 times |
Fri 05 September 2025 |
19.99 (4.01%) |
18.73 |
18.73 - 20.60 |
0.4252 times |
Fri 29 August 2025 |
19.22 (-7.51%) |
20.78 |
19.10 - 21.21 |
0.6538 times |
Fri 22 August 2025 |
20.78 (1.37%) |
20.39 |
19.54 - 21.20 |
0.9328 times |
Thu 14 August 2025 |
20.50 (2.81%) |
20.20 |
19.22 - 20.80 |
0.4787 times |
Fri 08 August 2025 |
19.94 (-4.73%) |
20.20 |
19.23 - 21.40 |
1.4991 times |
Fri 01 August 2025 |
20.93 (3.51%) |
20.40 |
19.25 - 21.33 |
1.4883 times |
Fri 25 July 2025 |
20.22 (-6.26%) |
21.22 |
20.05 - 21.95 |
0.934 times |
Monthly price and charts EnergyDeve Strong monthly Stock price targets for EnergyDeve ENERGYDEV_BE are 17.73 and 22.03 | Monthly Target 1 | 16.78 | | Monthly Target 2 | 18.67 | | Monthly Target 3 | 21.083333333333 | | Monthly Target 4 | 22.97 | | Monthly Target 5 | 25.38 |
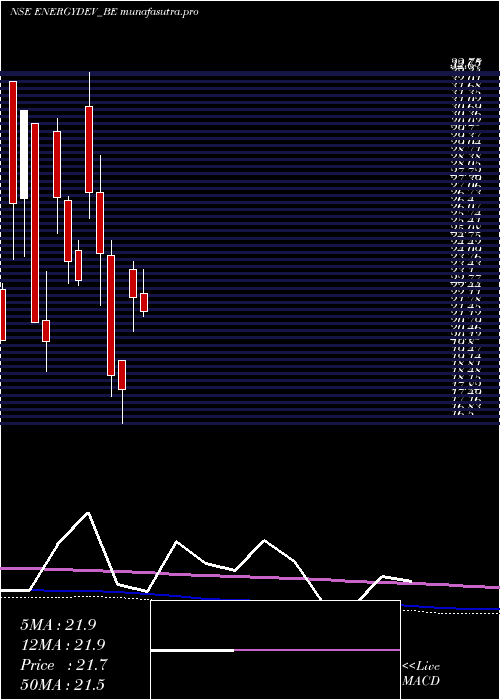
Monthly price and volumes Energy Deve
| Date |
Closing |
Open |
Range |
Volume |
Tue 09 December 2025 |
20.55 (2.8%) |
22.90 |
19.20 - 23.50 |
0.6698 times |
Fri 19 September 2025 |
19.99 (4.01%) |
18.73 |
18.73 - 20.90 |
0.3708 times |
Fri 29 August 2025 |
19.22 (-7.06%) |
20.68 |
19.10 - 21.40 |
0.8158 times |
Thu 31 July 2025 |
20.68 (-7.31%) |
22.50 |
19.25 - 23.65 |
1.104 times |
Mon 30 June 2025 |
22.31 (23.53%) |
23.62 |
20.76 - 24.00 |
0.8565 times |
Fri 21 March 2025 |
18.06 (-3.47%) |
19.40 |
16.50 - 19.40 |
1.1017 times |
Fri 28 February 2025 |
18.71 (-23.19%) |
24.27 |
17.75 - 24.99 |
1.1039 times |
Fri 31 January 2025 |
24.36 (-10.41%) |
27.19 |
21.95 - 28.89 |
1.7742 times |
Tue 31 December 2024 |
27.19 (17.71%) |
31.19 |
26.01 - 32.75 |
1.8584 times |
Mon 07 October 2024 |
23.10 (-3.71%) |
24.49 |
22.87 - 24.99 |
0.3448 times |
Mon 30 September 2024 |
23.99 (-11.08%) |
26.80 |
23.00 - 27.00 |
1.5828 times |
DMA SMA EMA moving averages of Energy Deve ENERGYDEV_BE
DMA (daily moving average) of Energy Deve ENERGYDEV_BE
| DMA period | DMA value | | 5 day DMA | 20.71 | | 12 day DMA | 20.45 | | 20 day DMA | 20.3 | | 35 day DMA | 20.24 | | 50 day DMA | 20.38 | | 100 day DMA | 20.29 | | 150 day DMA | 22.06 | | 200 day DMA | 22.64 | EMA (exponential moving average) of Energy Deve ENERGYDEV_BE
| EMA period | EMA current | EMA prev | EMA prev2 | | 5 day EMA | 20.55 | 20.55 | 20.81 | | 12 day EMA | 20.51 | 20.5 | 20.58 | | 20 day EMA | 20.41 | 20.4 | 20.44 | | 35 day EMA | 20.47 | 20.46 | 20.48 | | 50 day EMA | 20.53 | 20.53 | 20.55 |
SMA (simple moving average) of Energy Deve ENERGYDEV_BE
| SMA period | SMA current | SMA prev | SMA prev2 | | 5 day SMA | 20.71 | 21.06 | 21.05 | | 12 day SMA | 20.45 | 20.43 | 20.42 | | 20 day SMA | 20.3 | 20.26 | 20.22 | | 35 day SMA | 20.24 | 20.23 | 20.23 | | 50 day SMA | 20.38 | 20.4 | 20.44 | | 100 day SMA | 20.29 | 20.31 | 20.35 | | 150 day SMA | 22.06 | 22.09 | 22.12 | | 200 day SMA | 22.64 | 22.65 | 22.66 |
|
|
