EnergyDevelopment ENERGYDEV full analysis,charts,indicators,moving averages,SMA,DMA,EMA,ADX,MACD,RSIEnergy Development ENERGYDEV WideScreen charts, DMA,SMA,EMA technical analysis, forecast prediction, by indicators ADX,MACD,RSI,CCI NSE stock exchange
operates under Electric Utilities sector
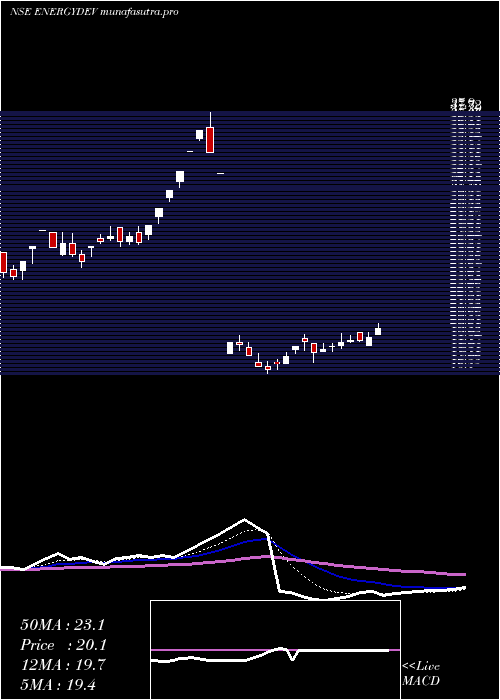
Daily price and charts and targets EnergyDevelopment Strong Daily Stock price targets for EnergyDevelopment ENERGYDEV are 19.65 and 19.99 | Daily Target 1 | 19.58 | | Daily Target 2 | 19.71 | | Daily Target 3 | 19.923333333333 | | Daily Target 4 | 20.05 | | Daily Target 5 | 20.26 |
Daily price and volume Energy Development
| Date |
Closing |
Open |
Range |
Volume |
Wed 29 October 2025 |
19.83 (-0.1%) |
19.94 |
19.80 - 20.14 |
0.3156 times |
Tue 28 October 2025 |
19.85 (-0.15%) |
19.99 |
19.73 - 20.20 |
0.6928 times |
Mon 27 October 2025 |
19.88 (-0.55%) |
20.18 |
19.80 - 20.30 |
0.2691 times |
Fri 24 October 2025 |
19.99 (0.55%) |
19.88 |
19.88 - 20.50 |
1.0981 times |
Thu 23 October 2025 |
19.88 (-1.49%) |
20.55 |
19.73 - 20.55 |
0.7372 times |
Tue 21 October 2025 |
20.18 (1.92%) |
19.56 |
19.56 - 20.50 |
0.3651 times |
Mon 20 October 2025 |
19.80 (-0.2%) |
20.03 |
19.70 - 20.50 |
0.9268 times |
Fri 17 October 2025 |
19.84 (-3.22%) |
20.60 |
19.49 - 20.90 |
2.5486 times |
Thu 16 October 2025 |
20.50 (2.96%) |
19.71 |
19.71 - 20.75 |
1.3061 times |
Wed 15 October 2025 |
19.91 (0.56%) |
19.84 |
19.39 - 20.85 |
1.7406 times |
Tue 14 October 2025 |
19.80 (0.51%) |
19.89 |
19.25 - 20.00 |
0.7432 times |
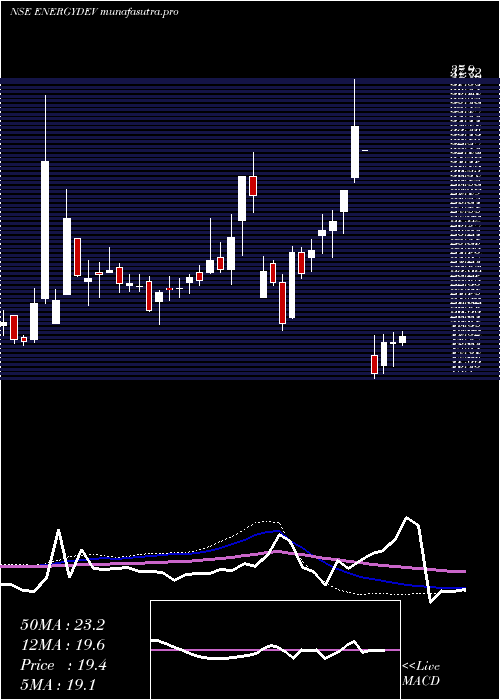
Weekly price and charts EnergyDevelopment Strong weekly Stock price targets for EnergyDevelopment ENERGYDEV are 19.5 and 20.07 | Weekly Target 1 | 19.38 | | Weekly Target 2 | 19.61 | | Weekly Target 3 | 19.953333333333 | | Weekly Target 4 | 20.18 | | Weekly Target 5 | 20.52 |
Weekly price and volumes for Energy Development
| Date |
Closing |
Open |
Range |
Volume |
Wed 29 October 2025 |
19.83 (-0.8%) |
20.18 |
19.73 - 20.30 |
0.0794 times |
Fri 24 October 2025 |
19.99 (0.76%) |
20.03 |
19.56 - 20.55 |
0.1944 times |
Fri 17 October 2025 |
19.84 (0.4%) |
19.52 |
19.16 - 20.90 |
0.428 times |
Fri 10 October 2025 |
19.76 (4.16%) |
19.10 |
18.81 - 21.24 |
0.4322 times |
Fri 03 October 2025 |
18.97 (-0.63%) |
19.40 |
18.55 - 19.55 |
0.1178 times |
Fri 26 September 2025 |
19.09 (-22.18%) |
20.93 |
18.82 - 21.00 |
0.2885 times |
Mon 16 June 2025 |
24.53 (-3.16%) |
24.95 |
23.77 - 26.75 |
0.737 times |
Fri 13 June 2025 |
25.33 (31.45%) |
19.15 |
19.15 - 29.85 |
7.1086 times |
Fri 06 June 2025 |
19.27 (-0.36%) |
19.35 |
18.70 - 20.40 |
0.4064 times |
Fri 30 May 2025 |
19.34 (-0.31%) |
19.59 |
18.86 - 20.47 |
0.2076 times |
Fri 23 May 2025 |
19.40 (-1.77%) |
19.95 |
19.01 - 20.40 |
0.3157 times |
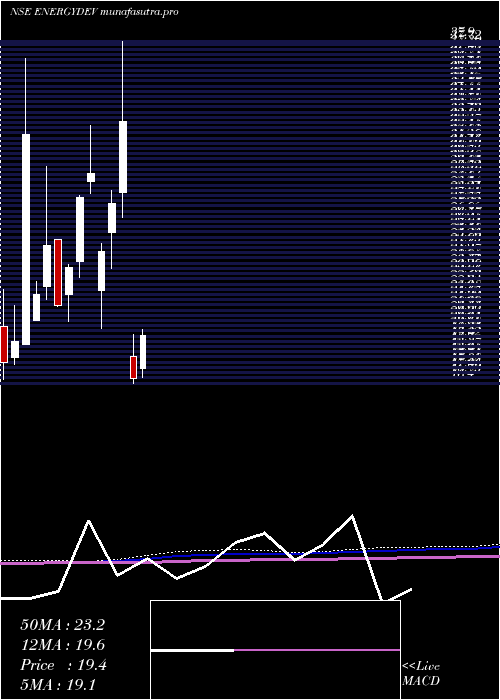
Monthly price and charts EnergyDevelopment Strong monthly Stock price targets for EnergyDevelopment ENERGYDEV are 19.32 and 21.76 | Monthly Target 1 | 17.52 | | Monthly Target 2 | 18.67 | | Monthly Target 3 | 19.956666666667 | | Monthly Target 4 | 21.11 | | Monthly Target 5 | 22.4 |
Monthly price and volumes Energy Development
| Date |
Closing |
Open |
Range |
Volume |
Wed 29 October 2025 |
19.83 (4.64%) |
18.95 |
18.80 - 21.24 |
0.4421 times |
Tue 30 September 2025 |
18.95 (-22.75%) |
20.93 |
18.55 - 21.00 |
0.1274 times |
Mon 16 June 2025 |
24.53 (26.84%) |
19.35 |
18.70 - 29.85 |
3.0507 times |
Fri 30 May 2025 |
19.34 (6.62%) |
18.57 |
17.01 - 20.86 |
0.4385 times |
Wed 30 April 2025 |
18.14 (8.56%) |
17.29 |
16.74 - 21.50 |
0.5272 times |
Fri 28 March 2025 |
16.71 (-49.12%) |
18.05 |
16.40 - 19.48 |
0.2302 times |
Mon 16 December 2024 |
32.84 (18.6%) |
28.40 |
26.80 - 37.90 |
1.5675 times |
Fri 29 November 2024 |
27.69 (12.24%) |
25.88 |
23.61 - 28.50 |
1.2929 times |
Thu 31 October 2024 |
24.67 (-16.54%) |
22.20 |
19.82 - 25.20 |
0.4322 times |
Wed 07 August 2024 |
29.56 (5.31%) |
29.09 |
28.35 - 32.64 |
1.8913 times |
Wed 31 July 2024 |
28.07 (18.64%) |
24.05 |
23.05 - 28.20 |
2.7368 times |
DMA SMA EMA moving averages of Energy Development ENERGYDEV
DMA (daily moving average) of Energy Development ENERGYDEV
| DMA period | DMA value | | 5 day DMA | 19.89 | | 12 day DMA | 19.93 | | 20 day DMA | 19.73 | | 35 day DMA | 20.48 | | 50 day DMA | 20.17 | | 100 day DMA | 21.36 | | 150 day DMA | 22.6 | | 200 day DMA | 22.72 | EMA (exponential moving average) of Energy Development ENERGYDEV
| EMA period | EMA current | EMA prev | EMA prev2 | | 5 day EMA | 19.88 | 19.91 | 19.94 | | 12 day EMA | 19.91 | 19.92 | 19.93 | | 20 day EMA | 19.97 | 19.99 | 20 | | 35 day EMA | 19.91 | 19.92 | 19.92 | | 50 day EMA | 19.98 | 19.99 | 20 |
SMA (simple moving average) of Energy Development ENERGYDEV
| SMA period | SMA current | SMA prev | SMA prev2 | | 5 day SMA | 19.89 | 19.96 | 19.95 | | 12 day SMA | 19.93 | 19.92 | 19.94 | | 20 day SMA | 19.73 | 19.68 | 19.64 | | 35 day SMA | 20.48 | 20.46 | 20.45 | | 50 day SMA | 20.17 | 20.15 | 20.13 | | 100 day SMA | 21.36 | 21.44 | 21.51 | | 150 day SMA | 22.6 | 22.64 | 22.67 | | 200 day SMA | 22.72 | 22.74 | 22.76 |
|
|
