EnergyMission EMMIL_SM full analysis,charts,indicators,moving averages,SMA,DMA,EMA,ADX,MACD,RSIEnergy Mission EMMIL_SM WideScreen charts, DMA,SMA,EMA technical analysis, forecast prediction, by indicators ADX,MACD,RSI,CCI NSE stock exchange
Daily price and charts and targets EnergyMission Strong Daily Stock price targets for EnergyMission EMMIL_SM are 173.3 and 177.2 | Daily Target 1 | 172.27 | | Daily Target 2 | 174.33 | | Daily Target 3 | 176.16666666667 | | Daily Target 4 | 178.23 | | Daily Target 5 | 180.07 |
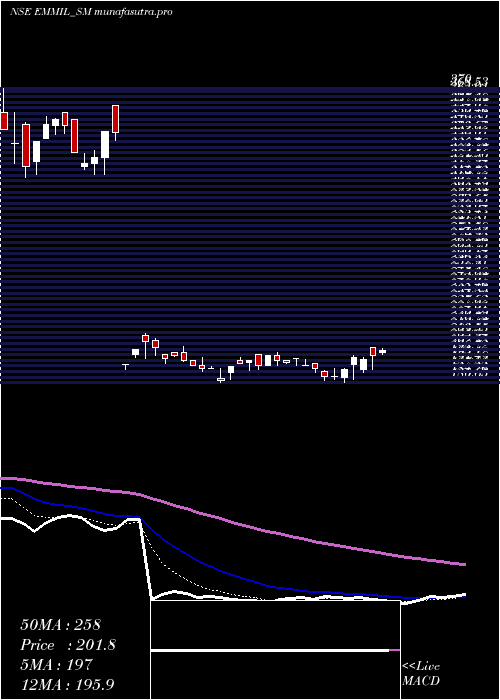
Daily price and volume Energy Mission
| Date |
Closing |
Open |
Range |
Volume |
Tue 28 October 2025 |
176.40 (-0.9%) |
178.00 |
174.10 - 178.00 |
0.6322 times |
Mon 27 October 2025 |
178.00 (0.85%) |
177.45 |
177.45 - 183.20 |
0.7471 times |
Fri 24 October 2025 |
176.50 (-2.73%) |
181.45 |
176.00 - 187.90 |
0.8621 times |
Thu 23 October 2025 |
181.45 (2.31%) |
176.50 |
176.50 - 182.50 |
1.6667 times |
Tue 21 October 2025 |
177.35 (-0.7%) |
178.50 |
172.50 - 182.55 |
0.6322 times |
Mon 20 October 2025 |
178.60 (3.96%) |
172.00 |
172.00 - 178.60 |
0.7471 times |
Fri 17 October 2025 |
171.80 (-1.07%) |
173.00 |
171.75 - 173.00 |
0.7471 times |
Thu 16 October 2025 |
173.65 (-2.69%) |
175.25 |
172.50 - 177.35 |
0.4598 times |
Wed 15 October 2025 |
178.45 (1.8%) |
175.35 |
171.70 - 180.00 |
2.8161 times |
Tue 14 October 2025 |
175.30 (-0.62%) |
176.20 |
175.30 - 179.00 |
0.6897 times |
Mon 13 October 2025 |
176.40 (2.53%) |
175.00 |
175.00 - 177.00 |
0.7471 times |
Weekly price and charts EnergyMission Strong weekly Stock price targets for EnergyMission EMMIL_SM are 170.7 and 179.8 | Weekly Target 1 | 168.8 | | Weekly Target 2 | 172.6 | | Weekly Target 3 | 177.9 | | Weekly Target 4 | 181.7 | | Weekly Target 5 | 187 |
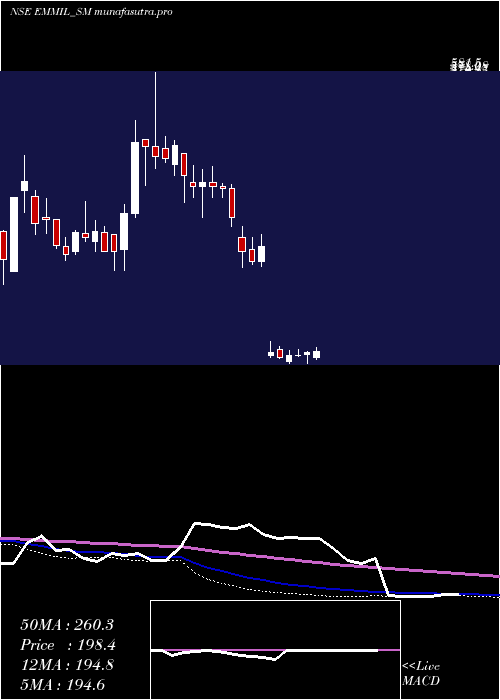
Weekly price and volumes for Energy Mission
| Date |
Closing |
Open |
Range |
Volume |
Tue 28 October 2025 |
176.40 (-0.06%) |
177.45 |
174.10 - 183.20 |
0.1275 times |
Fri 24 October 2025 |
176.50 (2.74%) |
172.00 |
172.00 - 187.90 |
0.3611 times |
Fri 17 October 2025 |
171.80 (-0.15%) |
175.00 |
171.70 - 180.00 |
0.5045 times |
Fri 10 October 2025 |
172.05 (-0.55%) |
173.60 |
170.05 - 177.85 |
0.3293 times |
Fri 03 October 2025 |
173.00 (-4.16%) |
178.10 |
170.00 - 182.50 |
0.7488 times |
Fri 26 September 2025 |
180.50 (-0.33%) |
183.00 |
178.05 - 189.30 |
0.6001 times |
Fri 19 September 2025 |
181.10 (-3.67%) |
188.00 |
180.00 - 188.00 |
2.103 times |
Fri 12 September 2025 |
188.00 (-2.59%) |
200.00 |
167.00 - 200.00 |
3.4679 times |
Fri 05 September 2025 |
193.00 (6.16%) |
182.00 |
182.00 - 199.00 |
0.8763 times |
Fri 29 August 2025 |
181.80 (-5.31%) |
194.80 |
181.00 - 194.80 |
0.8816 times |
Fri 22 August 2025 |
192.00 (-6.34%) |
200.00 |
190.00 - 200.00 |
0.9825 times |
Monthly price and charts EnergyMission Strong monthly Stock price targets for EnergyMission EMMIL_SM are 173.2 and 191.1 | Monthly Target 1 | 160.2 | | Monthly Target 2 | 168.3 | | Monthly Target 3 | 178.1 | | Monthly Target 4 | 186.2 | | Monthly Target 5 | 196 |
Monthly price and volumes Energy Mission
| Date |
Closing |
Open |
Range |
Volume |
Tue 28 October 2025 |
176.40 (-1.45%) |
173.30 |
170.00 - 187.90 |
0.1899 times |
Tue 30 September 2025 |
179.00 (-1.54%) |
182.00 |
167.00 - 200.00 |
0.7261 times |
Fri 29 August 2025 |
181.80 (-20.92%) |
229.90 |
181.00 - 239.95 |
0.3041 times |
Thu 31 July 2025 |
229.90 (16.11%) |
198.00 |
181.00 - 243.50 |
0.4071 times |
Mon 30 June 2025 |
198.00 (-42.11%) |
192.45 |
180.65 - 212.15 |
0.2742 times |
Wed 04 December 2024 |
342.00 (6.26%) |
322.00 |
315.00 - 359.40 |
0.2065 times |
Fri 29 November 2024 |
321.85 (-22.42%) |
418.00 |
313.00 - 429.90 |
1.3834 times |
Thu 31 October 2024 |
414.85 (-9.32%) |
455.00 |
383.05 - 488.55 |
1.3636 times |
Mon 30 September 2024 |
457.50 (17.78%) |
387.50 |
382.50 - 581.50 |
2.8532 times |
Fri 30 August 2024 |
388.45 (5.03%) |
370.00 |
309.95 - 400.00 |
2.2919 times |
Wed 31 July 2024 |
369.85 (-1.2%) |
381.95 |
323.15 - 409.00 |
2.2877 times |

DMA SMA EMA moving averages of Energy Mission EMMIL_SM
DMA (daily moving average) of Energy Mission EMMIL_SM
| DMA period | DMA value | | 5 day DMA | 177.94 | | 12 day DMA | 176.33 | | 20 day DMA | 176.06 | | 35 day DMA | 179.09 | | 50 day DMA | 182.96 | | 100 day DMA | 196.4 | | 150 day DMA | 270.06 | | 200 day DMA | 298.05 | EMA (exponential moving average) of Energy Mission EMMIL_SM
| EMA period | EMA current | EMA prev | EMA prev2 | | 5 day EMA | 177.23 | 177.65 | 177.47 | | 12 day EMA | 176.99 | 177.1 | 176.94 | | 20 day EMA | 177.75 | 177.89 | 177.88 | | 35 day EMA | 180.84 | 181.1 | 181.28 | | 50 day EMA | 184.59 | 184.92 | 185.2 |
SMA (simple moving average) of Energy Mission EMMIL_SM
| SMA period | SMA current | SMA prev | SMA prev2 | | 5 day SMA | 177.94 | 178.38 | 177.14 | | 12 day SMA | 176.33 | 175.95 | 175.93 | | 20 day SMA | 176.06 | 176.27 | 176.46 | | 35 day SMA | 179.09 | 179.56 | 180.06 | | 50 day SMA | 182.96 | 183.48 | 183.92 | | 100 day SMA | 196.4 | 197.9 | 199.34 | | 150 day SMA | 270.06 | 272.05 | 274.38 | | 200 day SMA | 298.05 | 298.98 | 299.99 |
|
|
