ElectronicsMart EMIL full analysis,charts,indicators,moving averages,SMA,DMA,EMA,ADX,MACD,RSIElectronics Mart EMIL WideScreen charts, DMA,SMA,EMA technical analysis, forecast prediction, by indicators ADX,MACD,RSI,CCI NSE stock exchange
Daily price and charts and targets ElectronicsMart Strong Daily Stock price targets for ElectronicsMart EMIL are 148.58 and 150.69 | Daily Target 1 | 146.94 | | Daily Target 2 | 148.1 | | Daily Target 3 | 149.04666666667 | | Daily Target 4 | 150.21 | | Daily Target 5 | 151.16 |
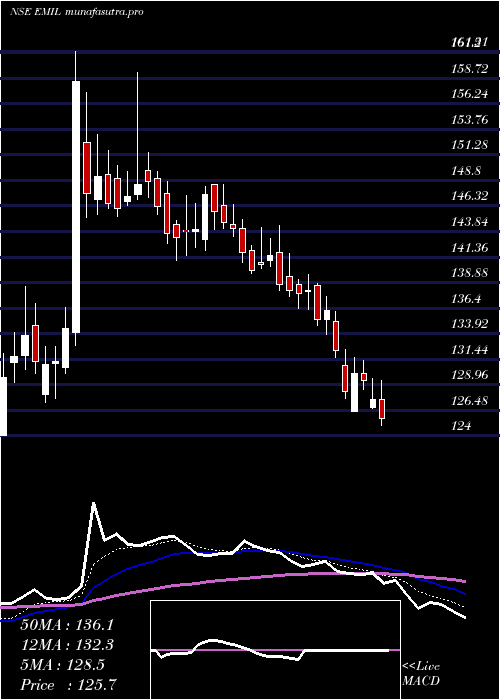
Daily price and volume Electronics Mart
| Date |
Closing |
Open |
Range |
Volume |
Tue 28 October 2025 |
149.27 (0.24%) |
149.05 |
147.88 - 149.99 |
0.4341 times |
Mon 27 October 2025 |
148.91 (-0.94%) |
151.99 |
147.60 - 151.99 |
0.5823 times |
Fri 24 October 2025 |
150.33 (-1.49%) |
152.50 |
149.90 - 152.85 |
0.638 times |
Thu 23 October 2025 |
152.60 (3.61%) |
147.70 |
147.70 - 155.76 |
3.221 times |
Tue 21 October 2025 |
147.28 (-0.37%) |
148.66 |
146.50 - 149.30 |
0.1847 times |
Mon 20 October 2025 |
147.83 (-0.94%) |
149.25 |
145.58 - 149.96 |
0.6781 times |
Fri 17 October 2025 |
149.24 (1.88%) |
145.47 |
144.97 - 149.79 |
0.8308 times |
Thu 16 October 2025 |
146.49 (0.11%) |
146.50 |
145.21 - 150.70 |
1.8185 times |
Wed 15 October 2025 |
146.33 (2.32%) |
142.50 |
142.49 - 146.98 |
0.9613 times |
Tue 14 October 2025 |
143.01 (0.49%) |
142.90 |
141.41 - 145.00 |
0.651 times |
Mon 13 October 2025 |
142.31 (-1.22%) |
143.00 |
141.10 - 143.56 |
0.8274 times |
Weekly price and charts ElectronicsMart Strong weekly Stock price targets for ElectronicsMart EMIL are 146.24 and 150.63 | Weekly Target 1 | 145.23 | | Weekly Target 2 | 147.25 | | Weekly Target 3 | 149.62 | | Weekly Target 4 | 151.64 | | Weekly Target 5 | 154.01 |
Weekly price and volumes for Electronics Mart
| Date |
Closing |
Open |
Range |
Volume |
Tue 28 October 2025 |
149.27 (-0.71%) |
151.99 |
147.60 - 151.99 |
0.0582 times |
Fri 24 October 2025 |
150.33 (0.73%) |
149.25 |
145.58 - 155.76 |
0.2703 times |
Fri 17 October 2025 |
149.24 (3.59%) |
143.00 |
141.10 - 150.70 |
0.2913 times |
Fri 10 October 2025 |
144.07 (0.54%) |
143.10 |
138.25 - 152.60 |
0.5623 times |
Fri 03 October 2025 |
143.29 (-2.19%) |
146.69 |
139.10 - 147.63 |
0.2713 times |
Fri 26 September 2025 |
146.50 (-7.22%) |
157.50 |
145.98 - 168.50 |
0.8769 times |
Fri 19 September 2025 |
157.90 (6.07%) |
149.70 |
146.10 - 164.64 |
1.1463 times |
Fri 12 September 2025 |
148.86 (-0.15%) |
149.80 |
145.51 - 157.86 |
1.1978 times |
Fri 05 September 2025 |
149.08 (19.13%) |
126.00 |
124.05 - 155.60 |
5.1871 times |
Fri 29 August 2025 |
125.14 (-4.77%) |
132.00 |
123.15 - 132.48 |
0.1385 times |
Fri 22 August 2025 |
131.41 (10.22%) |
125.00 |
123.77 - 135.30 |
0.5339 times |

Monthly price and charts ElectronicsMart Strong monthly Stock price targets for ElectronicsMart EMIL are 143.76 and 161.27 | Monthly Target 1 | 130.25 | | Monthly Target 2 | 139.76 | | Monthly Target 3 | 147.76 | | Monthly Target 4 | 157.27 | | Monthly Target 5 | 165.27 |
Monthly price and volumes Electronics Mart
| Date |
Closing |
Open |
Range |
Volume |
Tue 28 October 2025 |
149.27 (6.29%) |
141.00 |
138.25 - 155.76 |
0.487 times |
Tue 30 September 2025 |
140.44 (12.23%) |
126.00 |
124.05 - 168.50 |
3.1776 times |
Fri 29 August 2025 |
125.14 (-1.84%) |
127.49 |
113.51 - 135.30 |
0.4265 times |
Thu 31 July 2025 |
127.49 (-12.85%) |
147.48 |
126.40 - 148.73 |
0.4728 times |
Mon 30 June 2025 |
146.29 (21.64%) |
121.00 |
120.90 - 161.31 |
3.269 times |
Fri 30 May 2025 |
120.26 (-10.14%) |
134.90 |
115.35 - 138.57 |
0.682 times |
Wed 30 April 2025 |
133.83 (10.01%) |
123.53 |
111.11 - 158.77 |
0.3442 times |
Fri 28 March 2025 |
121.65 (-3.48%) |
126.03 |
112.60 - 133.67 |
0.344 times |
Fri 28 February 2025 |
126.03 (-14.2%) |
150.90 |
122.94 - 162.00 |
0.391 times |
Fri 31 January 2025 |
146.88 (-10.62%) |
164.55 |
139.70 - 167.50 |
0.4061 times |
Tue 31 December 2024 |
164.34 (-8.74%) |
179.95 |
162.01 - 185.65 |
0.3883 times |

DMA SMA EMA moving averages of Electronics Mart EMIL
DMA (daily moving average) of Electronics Mart EMIL
| DMA period | DMA value | | 5 day DMA | 149.68 | | 12 day DMA | 147.31 | | 20 day DMA | 145.3 | | 35 day DMA | 148.38 | | 50 day DMA | 142.85 | | 100 day DMA | 139.33 | | 150 day DMA | 135.57 | | 200 day DMA | 136.64 | EMA (exponential moving average) of Electronics Mart EMIL
| EMA period | EMA current | EMA prev | EMA prev2 | | 5 day EMA | 149.23 | 149.21 | 149.36 | | 12 day EMA | 148.01 | 147.78 | 147.57 | | 20 day EMA | 147.04 | 146.8 | 146.58 | | 35 day EMA | 143.75 | 143.43 | 143.11 | | 50 day EMA | 141.71 | 141.4 | 141.09 |
SMA (simple moving average) of Electronics Mart EMIL
| SMA period | SMA current | SMA prev | SMA prev2 | | 5 day SMA | 149.68 | 149.39 | 149.46 | | 12 day SMA | 147.31 | 146.82 | 146.58 | | 20 day SMA | 145.3 | 145.16 | 145.27 | | 35 day SMA | 148.38 | 148.37 | 148.28 | | 50 day SMA | 142.85 | 142.28 | 141.74 | | 100 day SMA | 139.33 | 139.09 | 138.82 | | 150 day SMA | 135.57 | 135.37 | 135.16 | | 200 day SMA | 136.64 | 136.71 | 136.78 |
|
|
