EmcurePharmaceuticals EMCURE full analysis,charts,indicators,moving averages,SMA,DMA,EMA,ADX,MACD,RSIEmcure Pharmaceuticals EMCURE WideScreen charts, DMA,SMA,EMA technical analysis, forecast prediction, by indicators ADX,MACD,RSI,CCI NSE stock exchange
Daily price and charts and targets EmcurePharmaceuticals Strong Daily Stock price targets for EmcurePharmaceuticals EMCURE are 1290.65 and 1353.35 | Daily Target 1 | 1278.87 | | Daily Target 2 | 1302.43 | | Daily Target 3 | 1341.5666666667 | | Daily Target 4 | 1365.13 | | Daily Target 5 | 1404.27 |
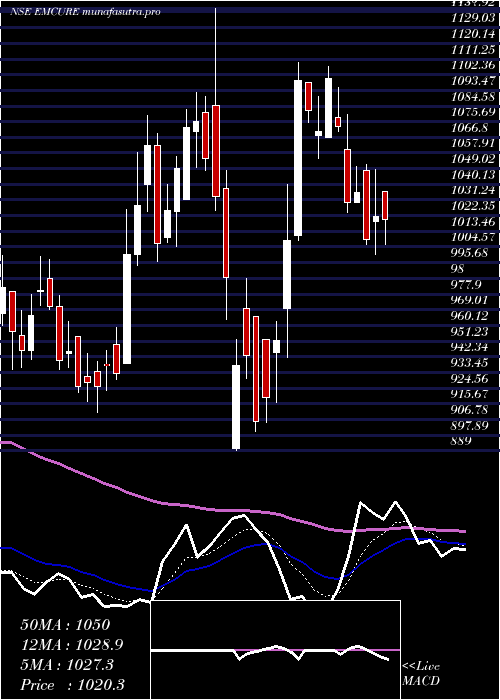
Daily price and volume Emcure Pharmaceuticals
| Date |
Closing |
Open |
Range |
Volume |
Tue 28 October 2025 |
1326.00 (-1.7%) |
1341.20 |
1318.00 - 1380.70 |
1.2017 times |
Mon 27 October 2025 |
1348.90 (-0.62%) |
1345.40 |
1345.40 - 1375.90 |
3.1375 times |
Fri 24 October 2025 |
1357.30 (-2%) |
1385.00 |
1345.00 - 1388.00 |
0.6883 times |
Thu 23 October 2025 |
1385.00 (-0.57%) |
1390.00 |
1377.10 - 1415.10 |
0.649 times |
Tue 21 October 2025 |
1393.00 (1.23%) |
1374.00 |
1374.00 - 1401.10 |
0.138 times |
Mon 20 October 2025 |
1376.10 (2.12%) |
1348.00 |
1340.10 - 1394.40 |
0.661 times |
Fri 17 October 2025 |
1347.50 (-0.21%) |
1359.90 |
1334.40 - 1373.10 |
0.387 times |
Thu 16 October 2025 |
1350.30 (-1.04%) |
1365.00 |
1341.10 - 1379.90 |
1.0102 times |
Wed 15 October 2025 |
1364.50 (1.9%) |
1349.90 |
1341.00 - 1374.90 |
1.1478 times |
Tue 14 October 2025 |
1339.00 (-2.31%) |
1370.00 |
1335.20 - 1391.00 |
0.9795 times |
Mon 13 October 2025 |
1370.60 (-3.7%) |
1405.20 |
1358.10 - 1422.70 |
1.2221 times |
Weekly price and charts EmcurePharmaceuticals Strong weekly Stock price targets for EmcurePharmaceuticals EMCURE are 1290.65 and 1353.35 | Weekly Target 1 | 1278.87 | | Weekly Target 2 | 1302.43 | | Weekly Target 3 | 1341.5666666667 | | Weekly Target 4 | 1365.13 | | Weekly Target 5 | 1404.27 |
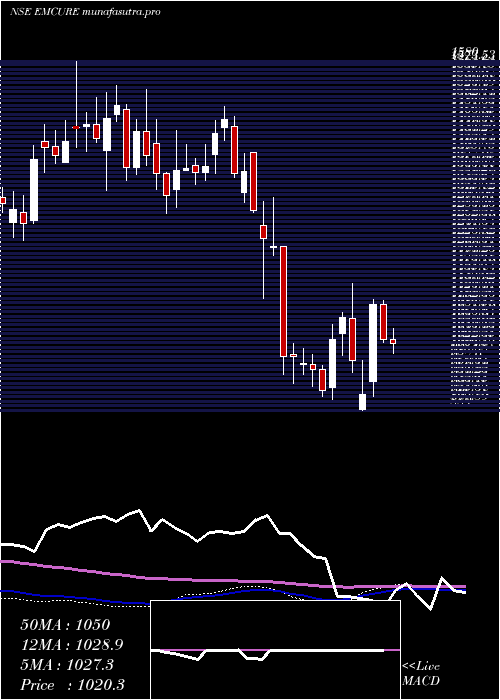
Weekly price and volumes for Emcure Pharmaceuticals
| Date |
Closing |
Open |
Range |
Volume |
Tue 28 October 2025 |
1326.00 (-2.31%) |
1345.40 |
1318.00 - 1380.70 |
0.8458 times |
Fri 24 October 2025 |
1357.30 (0.73%) |
1348.00 |
1340.10 - 1415.10 |
0.4164 times |
Fri 17 October 2025 |
1347.50 (-5.32%) |
1405.20 |
1334.40 - 1422.70 |
0.9251 times |
Fri 10 October 2025 |
1423.20 (6.22%) |
1350.40 |
1348.00 - 1448.80 |
2.4925 times |
Fri 03 October 2025 |
1339.90 (4.34%) |
1290.00 |
1260.00 - 1345.90 |
0.8324 times |
Fri 26 September 2025 |
1284.20 (-4.34%) |
1342.50 |
1276.50 - 1344.90 |
0.703 times |
Fri 19 September 2025 |
1342.50 (-0.47%) |
1348.90 |
1331.00 - 1375.00 |
1.0104 times |
Fri 12 September 2025 |
1348.90 (-1.73%) |
1378.00 |
1336.50 - 1399.00 |
0.7079 times |
Fri 05 September 2025 |
1372.70 (-1.49%) |
1393.40 |
1359.90 - 1409.90 |
0.8544 times |
Fri 29 August 2025 |
1393.40 (-6.68%) |
1500.50 |
1382.50 - 1509.00 |
1.2121 times |
Fri 22 August 2025 |
1493.10 (2.63%) |
1461.50 |
1432.80 - 1519.90 |
1.9043 times |
Monthly price and charts EmcurePharmaceuticals Strong monthly Stock price targets for EmcurePharmaceuticals EMCURE are 1293 and 1481.8 | Monthly Target 1 | 1156.13 | | Monthly Target 2 | 1241.07 | | Monthly Target 3 | 1344.9333333333 | | Monthly Target 4 | 1429.87 | | Monthly Target 5 | 1533.73 |
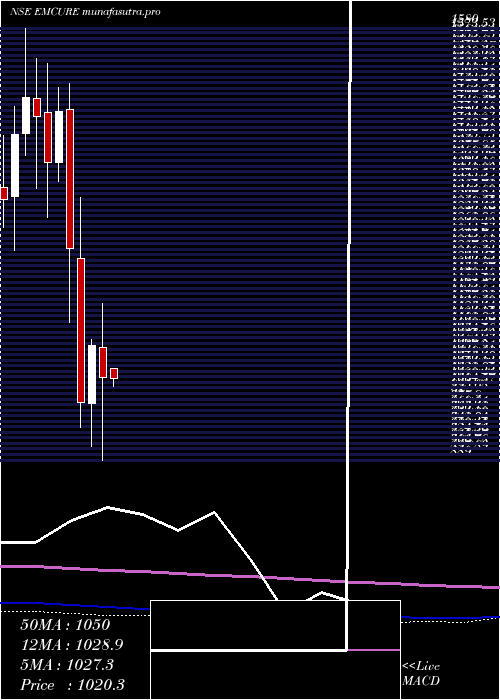
Monthly price and volumes Emcure Pharmaceuticals
| Date |
Closing |
Open |
Range |
Volume |
Tue 28 October 2025 |
1326.00 (3.6%) |
1260.00 |
1260.00 - 1448.80 |
0.5791 times |
Tue 30 September 2025 |
1279.90 (-8.15%) |
1393.40 |
1260.00 - 1409.90 |
0.404 times |
Fri 29 August 2025 |
1393.40 (-1.15%) |
1402.50 |
1317.00 - 1519.90 |
0.8432 times |
Thu 31 July 2025 |
1409.60 (8.95%) |
1310.00 |
1228.90 - 1458.00 |
2.9224 times |
Mon 30 June 2025 |
1293.80 (-2.71%) |
1353.90 |
1285.00 - 1430.00 |
1.1032 times |
Fri 30 May 2025 |
1329.90 (30.14%) |
1036.00 |
983.00 - 1412.80 |
1.2559 times |
Wed 30 April 2025 |
1021.90 (-4.71%) |
1070.00 |
889.00 - 1140.00 |
0.9597 times |
Fri 28 March 2025 |
1072.40 (9.24%) |
979.40 |
910.95 - 1082.80 |
0.6453 times |
Fri 28 February 2025 |
981.70 (-20.09%) |
1212.35 |
941.50 - 1310.00 |
0.7583 times |
Fri 31 January 2025 |
1228.50 (-15.11%) |
1449.90 |
1109.75 - 1491.90 |
0.5288 times |
Tue 31 December 2024 |
1447.10 (6.01%) |
1365.00 |
1336.10 - 1486.45 |
0.5807 times |
DMA SMA EMA moving averages of Emcure Pharmaceuticals EMCURE
DMA (daily moving average) of Emcure Pharmaceuticals EMCURE
| DMA period | DMA value | | 5 day DMA | 1362.04 | | 12 day DMA | 1365.12 | | 20 day DMA | 1360.18 | | 35 day DMA | 1353.29 | | 50 day DMA | 1377.2 | | 100 day DMA | 1364.53 | | 150 day DMA | 1272.48 | | 200 day DMA | 1239.86 | EMA (exponential moving average) of Emcure Pharmaceuticals EMCURE
| EMA period | EMA current | EMA prev | EMA prev2 | | 5 day EMA | 1350.95 | 1363.43 | 1370.69 | | 12 day EMA | 1359.27 | 1365.32 | 1368.31 | | 20 day EMA | 1360.98 | 1364.66 | 1366.32 | | 35 day EMA | 1371.28 | 1373.95 | 1375.43 | | 50 day EMA | 1377.95 | 1380.07 | 1381.34 |
SMA (simple moving average) of Emcure Pharmaceuticals EMCURE
| SMA period | SMA current | SMA prev | SMA prev2 | | 5 day SMA | 1362.04 | 1372.06 | 1371.78 | | 12 day SMA | 1365.12 | 1370.93 | 1373.67 | | 20 day SMA | 1360.18 | 1358.09 | 1356.93 | | 35 day SMA | 1353.29 | 1354.62 | 1355.24 | | 50 day SMA | 1377.2 | 1379.76 | 1380.95 | | 100 day SMA | 1364.53 | 1364.61 | 1364.35 | | 150 day SMA | 1272.48 | 1269.85 | 1267.11 | | 200 day SMA | 1239.86 | 1240.4 | 1240.98 |
|
|
