EmamiRealty EMAMIREAL full analysis,charts,indicators,moving averages,SMA,DMA,EMA,ADX,MACD,RSIEmami Realty EMAMIREAL WideScreen charts, DMA,SMA,EMA technical analysis, forecast prediction, by indicators ADX,MACD,RSI,CCI NSE stock exchange
Daily price and charts and targets EmamiRealty Strong Daily Stock price targets for EmamiRealty EMAMIREAL are 85.38 and 92.62 | Daily Target 1 | 79.34 | | Daily Target 2 | 84.17 | | Daily Target 3 | 86.583333333333 | | Daily Target 4 | 91.41 | | Daily Target 5 | 93.82 |
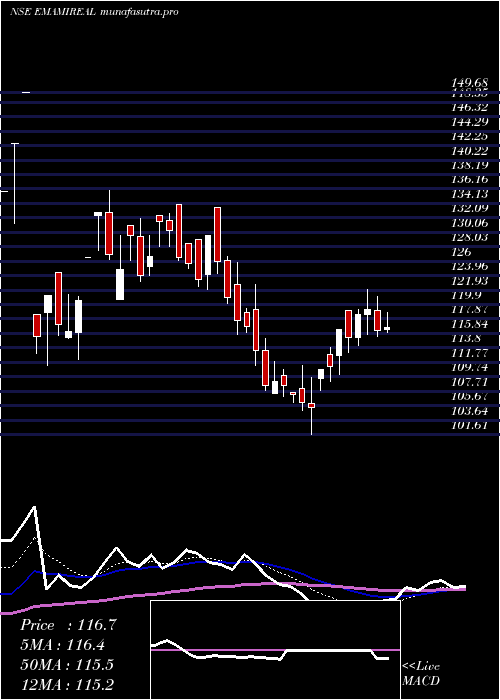
Daily price and volume Emami Realty
| Date |
Closing |
Open |
Range |
Volume |
Tue 28 October 2025 |
88.99 (4.98%) |
83.99 |
81.76 - 89.00 |
1.7579 times |
Mon 27 October 2025 |
84.77 (-5.01%) |
91.49 |
84.77 - 91.49 |
4.3904 times |
Fri 24 October 2025 |
89.24 (-5%) |
95.10 |
89.24 - 95.10 |
1.4913 times |
Thu 23 October 2025 |
93.94 (-0.3%) |
97.00 |
93.50 - 97.00 |
0.3275 times |
Tue 21 October 2025 |
94.22 (0.36%) |
98.45 |
92.25 - 98.45 |
0.2 times |
Mon 20 October 2025 |
93.88 (-1.16%) |
94.30 |
92.08 - 96.94 |
0.1658 times |
Fri 17 October 2025 |
94.98 (-3.13%) |
99.82 |
94.00 - 99.82 |
1.1897 times |
Thu 16 October 2025 |
98.05 (-2.75%) |
100.83 |
97.42 - 102.29 |
0.2741 times |
Wed 15 October 2025 |
100.82 (-0.16%) |
100.20 |
99.84 - 102.40 |
0.1085 times |
Tue 14 October 2025 |
100.98 (0.77%) |
98.22 |
98.22 - 102.18 |
0.0947 times |
Mon 13 October 2025 |
100.21 (-0.98%) |
103.01 |
100.20 - 103.02 |
0.1003 times |
Weekly price and charts EmamiRealty Strong weekly Stock price targets for EmamiRealty EMAMIREAL are 80.51 and 90.24 | Weekly Target 1 | 77.68 | | Weekly Target 2 | 83.34 | | Weekly Target 3 | 87.413333333333 | | Weekly Target 4 | 93.07 | | Weekly Target 5 | 97.14 |
Weekly price and volumes for Emami Realty
| Date |
Closing |
Open |
Range |
Volume |
Tue 28 October 2025 |
88.99 (-0.28%) |
91.49 |
81.76 - 91.49 |
2.4933 times |
Fri 24 October 2025 |
89.24 (-6.04%) |
94.30 |
89.24 - 98.45 |
0.8859 times |
Fri 17 October 2025 |
94.98 (-6.15%) |
103.01 |
94.00 - 103.02 |
0.7167 times |
Fri 10 October 2025 |
101.20 (-7.39%) |
107.00 |
98.00 - 109.44 |
0.9056 times |
Fri 03 October 2025 |
109.28 (-0.36%) |
111.59 |
107.00 - 111.59 |
0.2858 times |
Fri 26 September 2025 |
109.68 (-3.83%) |
114.05 |
108.51 - 115.37 |
0.4683 times |
Fri 19 September 2025 |
114.05 (-2.3%) |
117.74 |
111.12 - 121.35 |
0.8986 times |
Fri 12 September 2025 |
116.73 (0.63%) |
116.00 |
113.95 - 122.14 |
0.9888 times |
Fri 05 September 2025 |
116.00 (1.75%) |
113.29 |
112.00 - 119.90 |
1.0459 times |
Fri 29 August 2025 |
114.00 (-2.28%) |
118.51 |
111.25 - 129.00 |
1.3111 times |
Wed 21 May 2025 |
116.66 (-1.54%) |
118.48 |
115.36 - 121.99 |
0.5966 times |

Monthly price and charts EmamiRealty Strong monthly Stock price targets for EmamiRealty EMAMIREAL are 70.81 and 99.95 | Monthly Target 1 | 64.74 | | Monthly Target 2 | 76.87 | | Monthly Target 3 | 93.883333333333 | | Monthly Target 4 | 106.01 | | Monthly Target 5 | 123.02 |
Monthly price and volumes Emami Realty
| Date |
Closing |
Open |
Range |
Volume |
Tue 28 October 2025 |
88.99 (-18.26%) |
110.71 |
81.76 - 110.90 |
1.2433 times |
Tue 30 September 2025 |
108.87 (-4.5%) |
113.29 |
108.01 - 122.14 |
0.8536 times |
Fri 29 August 2025 |
114.00 (-2.28%) |
118.51 |
111.25 - 129.00 |
0.3164 times |
Wed 21 May 2025 |
116.66 (2.85%) |
113.43 |
101.61 - 121.99 |
0.3862 times |
Wed 30 April 2025 |
113.43 (-2.36%) |
116.00 |
111.35 - 135.99 |
1.1959 times |
Fri 28 March 2025 |
116.17 (-22.39%) |
118.46 |
111.33 - 124.35 |
0.6786 times |
Tue 10 December 2024 |
149.68 (40.66%) |
111.73 |
111.73 - 149.68 |
1.9609 times |
Fri 29 November 2024 |
106.41 (4.94%) |
103.99 |
89.21 - 106.41 |
1.2366 times |
Thu 31 October 2024 |
101.40 (-12.77%) |
110.96 |
94.53 - 125.00 |
1.601 times |
Wed 04 September 2024 |
116.24 (-3.89%) |
120.95 |
114.51 - 125.00 |
0.5275 times |
Fri 30 August 2024 |
120.95 (25.51%) |
98.00 |
88.10 - 129.00 |
11.3396 times |

DMA SMA EMA moving averages of Emami Realty EMAMIREAL
DMA (daily moving average) of Emami Realty EMAMIREAL
| DMA period | DMA value | | 5 day DMA | 90.23 | | 12 day DMA | 95.11 | | 20 day DMA | 99.37 | | 35 day DMA | 105.98 | | 50 day DMA | 109.28 | | 100 day DMA | 112.27 | | 150 day DMA | 109.8 | | 200 day DMA | 107.86 | EMA (exponential moving average) of Emami Realty EMAMIREAL
| EMA period | EMA current | EMA prev | EMA prev2 | | 5 day EMA | 89.96 | 90.45 | 93.29 | | 12 day EMA | 94.34 | 95.31 | 97.23 | | 20 day EMA | 98.12 | 99.08 | 100.59 | | 35 day EMA | 102.78 | 103.59 | 104.7 | | 50 day EMA | 107.27 | 108.02 | 108.97 |
SMA (simple moving average) of Emami Realty EMAMIREAL
| SMA period | SMA current | SMA prev | SMA prev2 | | 5 day SMA | 90.23 | 91.21 | 93.25 | | 12 day SMA | 95.11 | 96.01 | 97.23 | | 20 day SMA | 99.37 | 100.41 | 101.71 | | 35 day SMA | 105.98 | 106.76 | 107.61 | | 50 day SMA | 109.28 | 109.73 | 110.25 | | 100 day SMA | 112.27 | 112.34 | 112.48 | | 150 day SMA | 109.8 | 109.85 | 109.94 | | 200 day SMA | 107.86 | 107.96 | 108.09 |
|
|
