EmamiPaper EMAMIPAP full analysis,charts,indicators,moving averages,SMA,DMA,EMA,ADX,MACD,RSIEmami Paper EMAMIPAP WideScreen charts, DMA,SMA,EMA technical analysis, forecast prediction, by indicators ADX,MACD,RSI,CCI NSE stock exchange
Daily price and charts and targets EmamiPaper Strong Daily Stock price targets for EmamiPaper EMAMIPAP are 98.86 and 101.36 | Daily Target 1 | 96.87 | | Daily Target 2 | 98.34 | | Daily Target 3 | 99.37 | | Daily Target 4 | 100.84 | | Daily Target 5 | 101.87 |
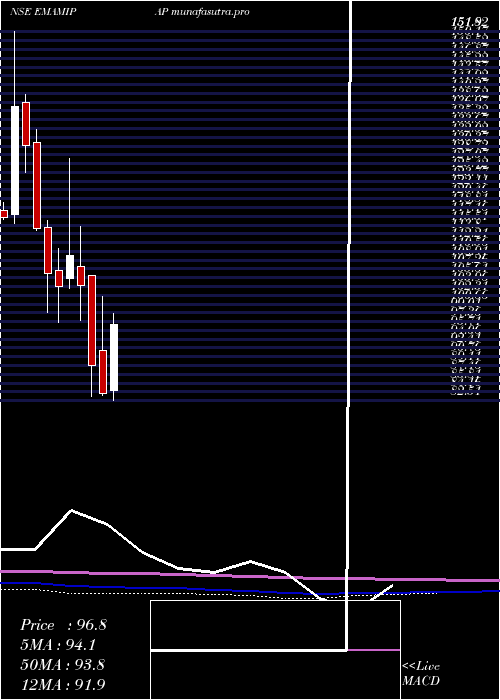
Daily price and volume Emami Paper
| Date |
Closing |
Open |
Range |
Volume |
Tue 28 October 2025 |
99.81 (1.92%) |
97.92 |
97.90 - 100.40 |
1.1301 times |
Mon 27 October 2025 |
97.93 (0.37%) |
99.00 |
97.70 - 99.50 |
0.8009 times |
Fri 24 October 2025 |
97.57 (0.06%) |
98.86 |
96.00 - 99.29 |
1.4166 times |
Thu 23 October 2025 |
97.51 (-1.31%) |
99.00 |
96.51 - 100.88 |
2.1484 times |
Tue 21 October 2025 |
98.80 (1.22%) |
97.61 |
97.61 - 99.70 |
0.2088 times |
Mon 20 October 2025 |
97.61 (-0.06%) |
99.10 |
97.45 - 99.10 |
0.7444 times |
Fri 17 October 2025 |
97.67 (-0.29%) |
97.98 |
97.01 - 99.27 |
0.4987 times |
Thu 16 October 2025 |
97.95 (-1.97%) |
99.92 |
97.11 - 101.29 |
1.8215 times |
Wed 15 October 2025 |
99.92 (-1.13%) |
101.58 |
99.26 - 101.75 |
0.5356 times |
Tue 14 October 2025 |
101.06 (-1.96%) |
103.00 |
100.15 - 103.56 |
0.695 times |
Mon 13 October 2025 |
103.08 (2.29%) |
101.10 |
99.12 - 104.20 |
1.7432 times |

Weekly price and charts EmamiPaper Strong weekly Stock price targets for EmamiPaper EMAMIPAP are 98.76 and 101.46 | Weekly Target 1 | 96.6 | | Weekly Target 2 | 98.21 | | Weekly Target 3 | 99.303333333333 | | Weekly Target 4 | 100.91 | | Weekly Target 5 | 102 |
Weekly price and volumes for Emami Paper
| Date |
Closing |
Open |
Range |
Volume |
Tue 28 October 2025 |
99.81 (2.3%) |
99.00 |
97.70 - 100.40 |
0.0592 times |
Fri 24 October 2025 |
97.57 (-0.1%) |
99.10 |
96.00 - 100.88 |
0.1386 times |
Fri 17 October 2025 |
97.67 (-3.08%) |
101.10 |
97.01 - 104.20 |
0.1624 times |
Fri 10 October 2025 |
100.77 (-1.34%) |
102.40 |
100.25 - 105.31 |
0.283 times |
Fri 03 October 2025 |
102.14 (4.79%) |
98.10 |
92.36 - 103.97 |
1.4125 times |
Fri 26 September 2025 |
97.47 (-5.59%) |
103.24 |
97.09 - 103.75 |
0.1717 times |
Fri 19 September 2025 |
103.24 (-0.64%) |
104.45 |
102.05 - 106.65 |
0.3157 times |
Fri 12 September 2025 |
103.91 (1.42%) |
103.00 |
101.00 - 114.80 |
0.9073 times |
Fri 05 September 2025 |
102.46 (0.8%) |
102.20 |
102.01 - 110.38 |
0.6073 times |
Fri 29 August 2025 |
101.65 (4.69%) |
103.19 |
100.55 - 122.00 |
5.9422 times |
Fri 22 August 2025 |
97.10 (4.1%) |
95.00 |
92.99 - 98.98 |
0.2702 times |

Monthly price and charts EmamiPaper Strong monthly Stock price targets for EmamiPaper EMAMIPAP are 97.46 and 107.67 | Monthly Target 1 | 89.86 | | Monthly Target 2 | 94.84 | | Monthly Target 3 | 100.07333333333 | | Monthly Target 4 | 105.05 | | Monthly Target 5 | 110.28 |
Monthly price and volumes Emami Paper
| Date |
Closing |
Open |
Range |
Volume |
Tue 28 October 2025 |
99.81 (5.3%) |
95.44 |
95.10 - 105.31 |
0.5123 times |
Tue 30 September 2025 |
94.79 (-6.75%) |
102.20 |
92.36 - 114.80 |
1.447 times |
Fri 29 August 2025 |
101.65 (5.86%) |
96.02 |
89.05 - 122.00 |
3.2522 times |
Thu 31 July 2025 |
96.02 (-4.25%) |
99.30 |
94.00 - 113.07 |
1.4771 times |
Mon 30 June 2025 |
100.28 (1.55%) |
98.75 |
91.20 - 105.00 |
0.424 times |
Fri 30 May 2025 |
98.75 (8.12%) |
92.70 |
86.50 - 102.00 |
0.5973 times |
Wed 30 April 2025 |
91.33 (8.96%) |
84.50 |
82.51 - 100.00 |
0.3959 times |
Fri 28 March 2025 |
83.82 (-5.86%) |
92.00 |
83.51 - 102.09 |
0.9271 times |
Fri 28 February 2025 |
89.04 (-14.57%) |
106.00 |
83.20 - 106.00 |
0.4156 times |
Fri 31 January 2025 |
104.22 (-5.05%) |
107.75 |
97.50 - 115.19 |
0.5515 times |
Tue 31 December 2024 |
109.76 (5.48%) |
105.50 |
103.60 - 128.00 |
3.5795 times |
DMA SMA EMA moving averages of Emami Paper EMAMIPAP
DMA (daily moving average) of Emami Paper EMAMIPAP
| DMA period | DMA value | | 5 day DMA | 98.32 | | 12 day DMA | 99.14 | | 20 day DMA | 99.55 | | 35 day DMA | 100.84 | | 50 day DMA | 101.02 | | 100 day DMA | 99.47 | | 150 day DMA | 97.42 | | 200 day DMA | 97.59 | EMA (exponential moving average) of Emami Paper EMAMIPAP
| EMA period | EMA current | EMA prev | EMA prev2 | | 5 day EMA | 98.62 | 98.02 | 98.07 | | 12 day EMA | 99.01 | 98.86 | 99.03 | | 20 day EMA | 99.46 | 99.42 | 99.58 | | 35 day EMA | 99.73 | 99.72 | 99.83 | | 50 day EMA | 100 | 100.01 | 100.1 |
SMA (simple moving average) of Emami Paper EMAMIPAP
| SMA period | SMA current | SMA prev | SMA prev2 | | 5 day SMA | 98.32 | 97.88 | 97.83 | | 12 day SMA | 99.14 | 99.35 | 99.66 | | 20 day SMA | 99.55 | 99.43 | 99.54 | | 35 day SMA | 100.84 | 100.92 | 101.09 | | 50 day SMA | 101.02 | 100.9 | 100.76 | | 100 day SMA | 99.47 | 99.45 | 99.44 | | 150 day SMA | 97.42 | 97.38 | 97.32 | | 200 day SMA | 97.59 | 97.63 | 97.7 |
|
|
