EllenbarrieIndus ELLEN full analysis,charts,indicators,moving averages,SMA,DMA,EMA,ADX,MACD,RSIEllenbarrie Indus ELLEN WideScreen charts, DMA,SMA,EMA technical analysis, forecast prediction, by indicators ADX,MACD,RSI,CCI NSE stock exchange
Daily price and charts and targets EllenbarrieIndus Strong Daily Stock price targets for EllenbarrieIndus ELLEN are 449.78 and 460.98 | Daily Target 1 | 440.88 | | Daily Target 2 | 447.47 | | Daily Target 3 | 452.08333333333 | | Daily Target 4 | 458.67 | | Daily Target 5 | 463.28 |
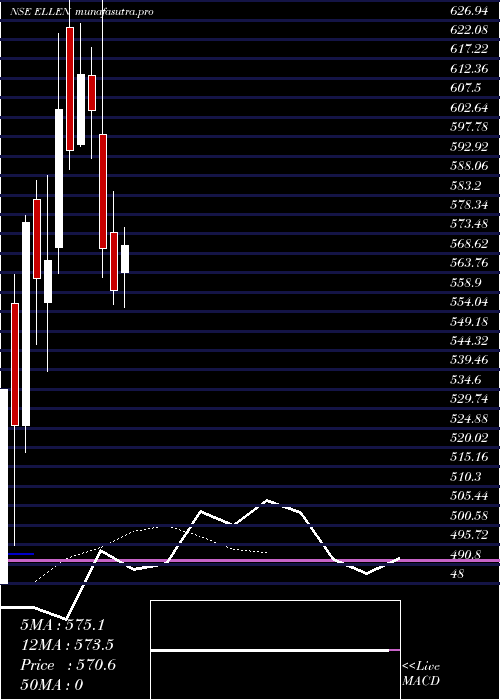
Daily price and volume Ellenbarrie Indus
| Date |
Closing |
Open |
Range |
Volume |
Wed 29 October 2025 |
454.05 (1.63%) |
451.70 |
445.50 - 456.70 |
0.9468 times |
Tue 28 October 2025 |
446.75 (-1.89%) |
455.35 |
444.35 - 457.95 |
0.7028 times |
Mon 27 October 2025 |
455.35 (2.7%) |
446.40 |
443.30 - 459.45 |
1.2264 times |
Fri 24 October 2025 |
443.40 (-2.59%) |
458.00 |
442.00 - 458.55 |
0.7491 times |
Thu 23 October 2025 |
455.20 (-1.32%) |
470.00 |
452.05 - 470.00 |
0.5866 times |
Tue 21 October 2025 |
461.30 (2.64%) |
454.50 |
451.45 - 463.95 |
0.3961 times |
Mon 20 October 2025 |
449.45 (-2.07%) |
466.00 |
447.80 - 466.00 |
0.8213 times |
Fri 17 October 2025 |
458.95 (-0.55%) |
464.00 |
454.75 - 466.20 |
1.266 times |
Thu 16 October 2025 |
461.50 (4.07%) |
443.25 |
443.25 - 469.95 |
1.8343 times |
Wed 15 October 2025 |
443.45 (-2.14%) |
453.15 |
439.05 - 454.90 |
1.4706 times |
Tue 14 October 2025 |
453.15 (-0.13%) |
460.00 |
448.00 - 470.30 |
1.5369 times |
Weekly price and charts EllenbarrieIndus Strong weekly Stock price targets for EllenbarrieIndus ELLEN are 448.68 and 464.83 | Weekly Target 1 | 436.12 | | Weekly Target 2 | 445.08 | | Weekly Target 3 | 452.26666666667 | | Weekly Target 4 | 461.23 | | Weekly Target 5 | 468.42 |
Weekly price and volumes for Ellenbarrie Indus
| Date |
Closing |
Open |
Range |
Volume |
Wed 29 October 2025 |
454.05 (2.4%) |
446.40 |
443.30 - 459.45 |
0.3383 times |
Fri 24 October 2025 |
443.40 (-3.39%) |
466.00 |
442.00 - 470.00 |
0.3004 times |
Fri 17 October 2025 |
458.95 (3.02%) |
447.00 |
439.05 - 470.30 |
0.9442 times |
Fri 10 October 2025 |
445.50 (-5.05%) |
469.90 |
430.35 - 473.00 |
1.6524 times |
Fri 03 October 2025 |
469.20 (-3.66%) |
493.60 |
467.00 - 502.00 |
0.5983 times |
Fri 26 September 2025 |
487.00 (-7.64%) |
536.20 |
485.00 - 536.20 |
0.517 times |
Fri 19 September 2025 |
527.30 (-4.22%) |
551.00 |
525.00 - 559.80 |
0.736 times |
Fri 12 September 2025 |
550.55 (5.17%) |
520.05 |
517.00 - 559.40 |
2.6206 times |
Fri 05 September 2025 |
523.50 (1.18%) |
513.30 |
505.70 - 541.60 |
0.8167 times |
Fri 29 August 2025 |
517.40 (-1.9%) |
527.40 |
507.40 - 538.70 |
1.4762 times |
Fri 22 August 2025 |
527.40 (5.64%) |
510.00 |
487.60 - 534.50 |
2.0368 times |

Monthly price and charts EllenbarrieIndus Strong monthly Stock price targets for EllenbarrieIndus ELLEN are 417.38 and 467.03 | Monthly Target 1 | 405.15 | | Monthly Target 2 | 429.6 | | Monthly Target 3 | 454.8 | | Monthly Target 4 | 479.25 | | Monthly Target 5 | 504.45 |
Monthly price and volumes Ellenbarrie Indus
| Date |
Closing |
Open |
Range |
Volume |
Wed 29 October 2025 |
454.05 (-3.33%) |
469.90 |
430.35 - 480.00 |
0.1908 times |
Tue 30 September 2025 |
469.70 (-9.22%) |
513.30 |
467.00 - 559.80 |
0.2612 times |
Fri 29 August 2025 |
517.40 (-10.43%) |
578.95 |
487.60 - 600.15 |
0.4578 times |
Thu 31 July 2025 |
577.65 (0%) |
486.00 |
486.00 - 637.70 |
3.0903 times |
Thu 30 October 2025 |
(0%) |
|
- |
0 times |

DMA SMA EMA moving averages of Ellenbarrie Indus ELLEN
DMA (daily moving average) of Ellenbarrie Indus ELLEN
| DMA period | DMA value | | 5 day DMA | 450.95 | | 12 day DMA | 453.03 | | 20 day DMA | 453.23 | | 35 day DMA | 485.1 | | 50 day DMA | 495.28 | | 100 day DMA | | | 150 day DMA | | | 200 day DMA | | EMA (exponential moving average) of Ellenbarrie Indus ELLEN
| EMA period | EMA current | EMA prev | EMA prev2 | | 5 day EMA | 451.87 | 450.78 | 452.79 | | 12 day EMA | 454.28 | 454.32 | 455.69 | | 20 day EMA | 461.14 | 461.89 | 463.48 | | 35 day EMA | 474.6 | 475.81 | 477.52 | | 50 day EMA | 492.19 | 493.75 | 495.67 |
SMA (simple moving average) of Ellenbarrie Indus ELLEN
| SMA period | SMA current | SMA prev | SMA prev2 | | 5 day SMA | 450.95 | 452.4 | 452.94 | | 12 day SMA | 453.03 | 452.31 | 451.26 | | 20 day SMA | 453.23 | 454.49 | 456.5 | | 35 day SMA | 485.1 | 487.51 | 489.7 | | 50 day SMA | 495.28 | 496.18 | 497.48 | | 100 day SMA | | 150 day SMA | | 200 day SMA |
|
|
