ElinElectronics ELIN full analysis,charts,indicators,moving averages,SMA,DMA,EMA,ADX,MACD,RSIElin Electronics ELIN WideScreen charts, DMA,SMA,EMA technical analysis, forecast prediction, by indicators ADX,MACD,RSI,CCI NSE stock exchange
Daily price and charts and targets ElinElectronics Strong Daily Stock price targets for ElinElectronics ELIN are 211.34 and 217.47 | Daily Target 1 | 206.6 | | Daily Target 2 | 209.95 | | Daily Target 3 | 212.72666666667 | | Daily Target 4 | 216.08 | | Daily Target 5 | 218.86 |
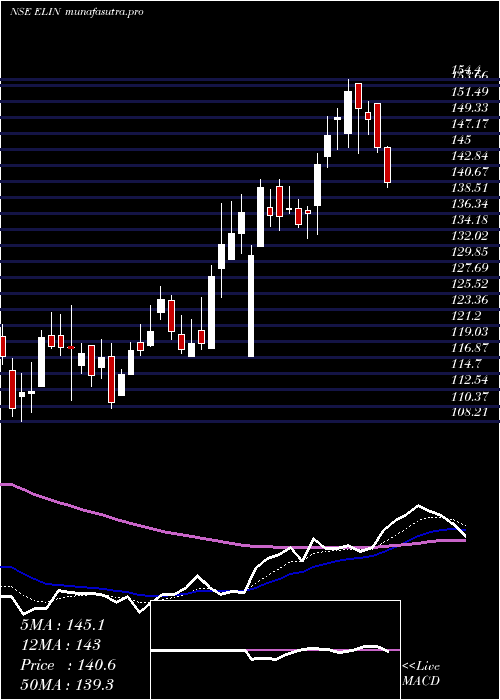
Daily price and volume Elin Electronics
| Date |
Closing |
Open |
Range |
Volume |
Tue 28 October 2025 |
213.31 (1.03%) |
212.00 |
209.37 - 215.50 |
1.1893 times |
Mon 27 October 2025 |
211.13 (2.62%) |
205.73 |
204.09 - 211.98 |
1.9013 times |
Fri 24 October 2025 |
205.73 (3.38%) |
201.00 |
198.01 - 207.00 |
1.191 times |
Thu 23 October 2025 |
199.01 (-2.78%) |
207.50 |
195.21 - 207.50 |
0.8193 times |
Tue 21 October 2025 |
204.71 (3.94%) |
197.66 |
197.66 - 206.88 |
0.6916 times |
Mon 20 October 2025 |
196.95 (1.22%) |
196.30 |
193.64 - 199.63 |
0.5249 times |
Fri 17 October 2025 |
194.58 (-1.43%) |
198.40 |
190.15 - 203.00 |
1.17 times |
Thu 16 October 2025 |
197.41 (-1.2%) |
199.81 |
196.30 - 205.00 |
0.6731 times |
Wed 15 October 2025 |
199.81 (2.56%) |
194.33 |
192.30 - 200.94 |
0.7187 times |
Tue 14 October 2025 |
194.83 (-1.75%) |
197.00 |
192.55 - 200.64 |
1.1209 times |
Mon 13 October 2025 |
198.31 (-2.34%) |
202.00 |
197.05 - 202.90 |
0.9354 times |
Weekly price and charts ElinElectronics Strong weekly Stock price targets for ElinElectronics ELIN are 208.7 and 220.11 | Weekly Target 1 | 199.56 | | Weekly Target 2 | 206.43 | | Weekly Target 3 | 210.96666666667 | | Weekly Target 4 | 217.84 | | Weekly Target 5 | 222.38 |
Weekly price and volumes for Elin Electronics
| Date |
Closing |
Open |
Range |
Volume |
Tue 28 October 2025 |
213.31 (3.68%) |
205.73 |
204.09 - 215.50 |
0.2834 times |
Fri 24 October 2025 |
205.73 (5.73%) |
196.30 |
193.64 - 207.50 |
0.2959 times |
Fri 17 October 2025 |
194.58 (-4.18%) |
202.00 |
190.15 - 205.00 |
0.4234 times |
Fri 10 October 2025 |
203.07 (-5.2%) |
214.22 |
198.00 - 214.66 |
0.5116 times |
Fri 03 October 2025 |
214.22 (5.57%) |
204.50 |
197.00 - 215.95 |
0.4453 times |
Fri 26 September 2025 |
202.91 (-9.72%) |
227.00 |
201.25 - 234.00 |
1.7743 times |
Fri 19 September 2025 |
224.75 (1.18%) |
220.30 |
213.25 - 229.45 |
1.18 times |
Fri 12 September 2025 |
222.13 (3.55%) |
218.00 |
211.65 - 231.00 |
2.7553 times |
Fri 05 September 2025 |
214.51 (15.19%) |
184.00 |
183.00 - 220.11 |
1.7949 times |
Fri 29 August 2025 |
186.23 (0.13%) |
188.00 |
178.00 - 189.90 |
0.536 times |
Fri 23 May 2025 |
185.98 (5.46%) |
177.00 |
171.01 - 190.70 |
3.2058 times |

Monthly price and charts ElinElectronics Strong monthly Stock price targets for ElinElectronics ELIN are 201.73 and 227.53 | Monthly Target 1 | 180.67 | | Monthly Target 2 | 196.99 | | Monthly Target 3 | 206.47 | | Monthly Target 4 | 222.79 | | Monthly Target 5 | 232.27 |
Monthly price and volumes Elin Electronics
| Date |
Closing |
Open |
Range |
Volume |
Tue 28 October 2025 |
213.31 (5.67%) |
202.00 |
190.15 - 215.95 |
0.3556 times |
Tue 30 September 2025 |
201.87 (8.4%) |
184.00 |
183.00 - 234.00 |
1.5524 times |
Fri 29 August 2025 |
186.23 (0.13%) |
188.00 |
178.00 - 189.90 |
0.1081 times |
Fri 23 May 2025 |
185.98 (32.32%) |
139.55 |
129.81 - 190.70 |
1.8897 times |
Wed 30 April 2025 |
140.55 (18.36%) |
118.07 |
117.00 - 154.40 |
1.1112 times |
Fri 28 March 2025 |
118.75 (7.98%) |
111.59 |
108.21 - 126.51 |
1.5796 times |
Fri 28 February 2025 |
109.97 (-31.8%) |
164.05 |
109.00 - 165.75 |
0.6576 times |
Fri 31 January 2025 |
161.25 (-23.11%) |
210.70 |
136.62 - 212.76 |
0.9169 times |
Tue 31 December 2024 |
209.71 (-4.03%) |
218.00 |
197.04 - 235.00 |
1.0628 times |
Fri 29 November 2024 |
218.51 (1.06%) |
217.10 |
198.92 - 239.37 |
0.7662 times |
Thu 31 October 2024 |
216.22 (-7.33%) |
232.65 |
198.41 - 244.60 |
1.2885 times |

DMA SMA EMA moving averages of Elin Electronics ELIN
DMA (daily moving average) of Elin Electronics ELIN
| DMA period | DMA value | | 5 day DMA | 206.78 | | 12 day DMA | 201.57 | | 20 day DMA | 203.13 | | 35 day DMA | 210.56 | | 50 day DMA | 203.33 | | 100 day DMA | 167.75 | | 150 day DMA | 168.56 | | 200 day DMA | 181.18 | EMA (exponential moving average) of Elin Electronics ELIN
| EMA period | EMA current | EMA prev | EMA prev2 | | 5 day EMA | 207.62 | 204.77 | 201.59 | | 12 day EMA | 204.69 | 203.12 | 201.66 | | 20 day EMA | 204.43 | 203.5 | 202.7 | | 35 day EMA | 201.27 | 200.56 | 199.94 | | 50 day EMA | 200.09 | 199.55 | 199.08 |
SMA (simple moving average) of Elin Electronics ELIN
| SMA period | SMA current | SMA prev | SMA prev2 | | 5 day SMA | 206.78 | 203.51 | 200.2 | | 12 day SMA | 201.57 | 200.55 | 199.7 | | 20 day SMA | 203.13 | 202.61 | 202.73 | | 35 day SMA | 210.56 | 210.6 | 210.16 | | 50 day SMA | 203.33 | 202.53 | 201.62 | | 100 day SMA | 167.75 | 166.81 | 165.9 | | 150 day SMA | 168.56 | 168.58 | 168.63 | | 200 day SMA | 181.18 | 181.26 | 181.42 |
|
|
