EldecoHsg ELDEHSG full analysis,charts,indicators,moving averages,SMA,DMA,EMA,ADX,MACD,RSIEldeco Hsg ELDEHSG WideScreen charts, DMA,SMA,EMA technical analysis, forecast prediction, by indicators ADX,MACD,RSI,CCI NSE stock exchange
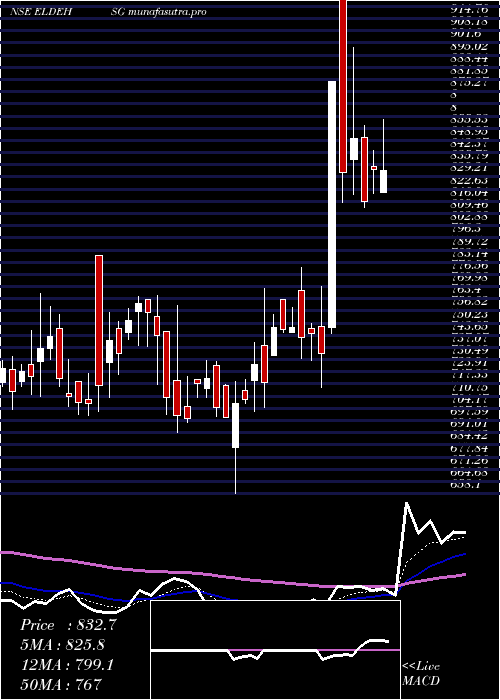
Daily price and charts and targets EldecoHsg Strong Daily Stock price targets for EldecoHsg ELDEHSG are 812.08 and 862.08 | Daily Target 1 | 801.85 | | Daily Target 2 | 822.3 | | Daily Target 3 | 851.85 | | Daily Target 4 | 872.3 | | Daily Target 5 | 901.85 |
Daily price and volume Eldeco Hsg
| Date |
Closing |
Open |
Range |
Volume |
Tue 28 October 2025 |
842.75 (-1.92%) |
859.20 |
831.40 - 881.40 |
0.2512 times |
Mon 27 October 2025 |
859.25 (-3.88%) |
907.95 |
843.60 - 920.00 |
0.6604 times |
Fri 24 October 2025 |
893.95 (6.3%) |
845.80 |
845.80 - 899.00 |
1.4509 times |
Thu 23 October 2025 |
840.95 (1.72%) |
826.70 |
822.40 - 866.75 |
1.3282 times |
Tue 21 October 2025 |
826.70 (-0.31%) |
805.00 |
805.00 - 841.80 |
0.116 times |
Mon 20 October 2025 |
829.30 (-5.09%) |
862.65 |
811.00 - 870.00 |
0.1422 times |
Fri 17 October 2025 |
873.75 (-1.08%) |
855.00 |
855.00 - 890.00 |
0.5956 times |
Thu 16 October 2025 |
883.30 (7.09%) |
831.60 |
814.75 - 890.00 |
3.4917 times |
Wed 15 October 2025 |
824.80 (2.91%) |
807.20 |
791.45 - 845.00 |
1.6626 times |
Tue 14 October 2025 |
801.50 (0.19%) |
801.45 |
799.45 - 805.00 |
0.3012 times |
Mon 13 October 2025 |
800.00 (-0.04%) |
812.35 |
799.20 - 812.70 |
0.3562 times |
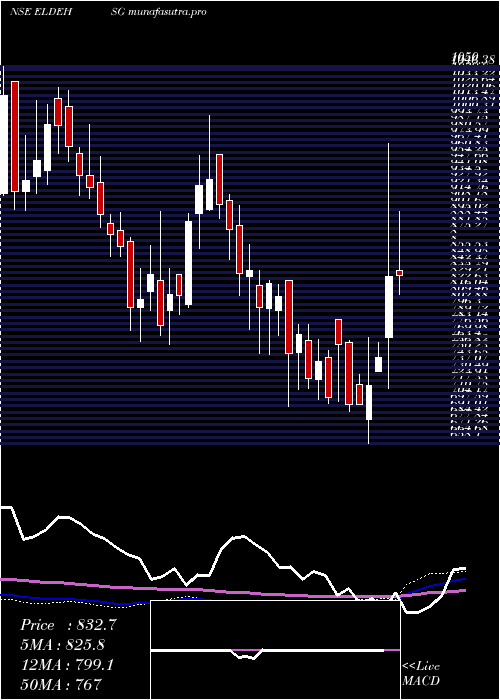
Weekly price and charts EldecoHsg Strong weekly Stock price targets for EldecoHsg ELDEHSG are 792.78 and 881.38 | Weekly Target 1 | 776.12 | | Weekly Target 2 | 809.43 | | Weekly Target 3 | 864.71666666667 | | Weekly Target 4 | 898.03 | | Weekly Target 5 | 953.32 |
Weekly price and volumes for Eldeco Hsg
| Date |
Closing |
Open |
Range |
Volume |
Tue 28 October 2025 |
842.75 (-5.73%) |
907.95 |
831.40 - 920.00 |
0.2478 times |
Fri 24 October 2025 |
893.95 (2.31%) |
862.65 |
805.00 - 899.00 |
0.8255 times |
Fri 17 October 2025 |
873.75 (9.17%) |
812.35 |
791.45 - 890.00 |
1.7415 times |
Fri 10 October 2025 |
800.35 (-0.06%) |
795.30 |
766.65 - 814.45 |
0.8345 times |
Fri 03 October 2025 |
800.85 (0.6%) |
784.10 |
784.10 - 824.10 |
0.5127 times |
Fri 26 September 2025 |
796.05 (-0.43%) |
804.70 |
777.35 - 810.95 |
0.6717 times |
Fri 19 September 2025 |
799.45 (0.41%) |
802.20 |
743.40 - 820.00 |
1.2395 times |
Fri 12 September 2025 |
796.20 (3.6%) |
781.00 |
747.65 - 824.90 |
1.6074 times |
Fri 05 September 2025 |
768.50 (6.07%) |
738.20 |
691.20 - 795.00 |
2.1262 times |
Fri 29 August 2025 |
724.50 (-2.93%) |
757.25 |
720.00 - 759.85 |
0.1931 times |
Fri 22 August 2025 |
746.35 (1.97%) |
739.95 |
725.15 - 778.00 |
0.7216 times |
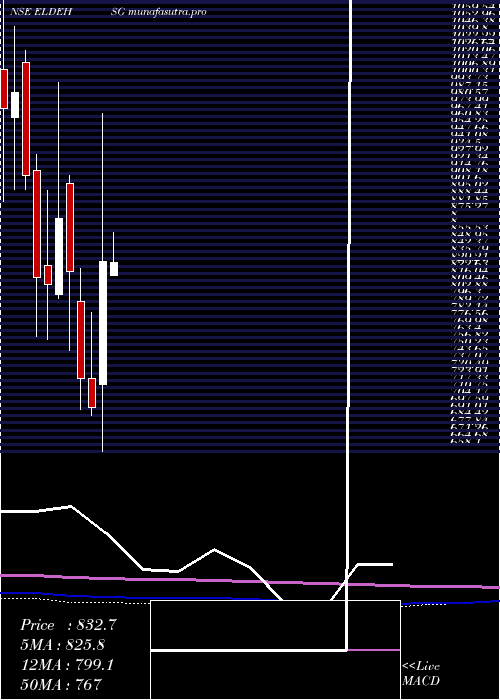
Monthly price and charts EldecoHsg Strong monthly Stock price targets for EldecoHsg ELDEHSG are 804.7 and 958.05 | Monthly Target 1 | 689.78 | | Monthly Target 2 | 766.27 | | Monthly Target 3 | 843.13333333333 | | Monthly Target 4 | 919.62 | | Monthly Target 5 | 996.48 |
Monthly price and volumes Eldeco Hsg
| Date |
Closing |
Open |
Range |
Volume |
Tue 28 October 2025 |
842.75 (3.32%) |
815.65 |
766.65 - 920.00 |
1.3796 times |
Tue 30 September 2025 |
815.65 (12.58%) |
738.20 |
691.20 - 824.90 |
2.1042 times |
Fri 29 August 2025 |
724.50 (-2.31%) |
733.85 |
703.85 - 779.85 |
1.2877 times |
Thu 31 July 2025 |
741.60 (-7.93%) |
810.75 |
740.00 - 810.75 |
0.5288 times |
Mon 30 June 2025 |
805.50 (-0.46%) |
825.30 |
770.05 - 839.95 |
0.4001 times |
Fri 30 May 2025 |
809.25 (-2.86%) |
820.85 |
745.05 - 860.00 |
0.5216 times |
Wed 30 April 2025 |
833.05 (19.2%) |
720.00 |
658.10 - 969.80 |
2.2639 times |
Fri 28 March 2025 |
698.85 (-3.67%) |
725.10 |
691.15 - 786.80 |
0.5942 times |
Fri 28 February 2025 |
725.50 (-11.98%) |
796.95 |
697.00 - 827.15 |
0.4847 times |
Fri 31 January 2025 |
824.25 (-5.62%) |
905.00 |
751.00 - 913.25 |
0.4353 times |
Tue 31 December 2024 |
873.30 (7.56%) |
802.80 |
799.60 - 998.90 |
0.7498 times |
DMA SMA EMA moving averages of Eldeco Hsg ELDEHSG
DMA (daily moving average) of Eldeco Hsg ELDEHSG
| DMA period | DMA value | | 5 day DMA | 852.72 | | 12 day DMA | 839.72 | | 20 day DMA | 824.74 | | 35 day DMA | 811.73 | | 50 day DMA | 789.77 | | 100 day DMA | 783.97 | | 150 day DMA | 782.83 | | 200 day DMA | 781.45 | EMA (exponential moving average) of Eldeco Hsg ELDEHSG
| EMA period | EMA current | EMA prev | EMA prev2 | | 5 day EMA | 852.54 | 857.44 | 856.53 | | 12 day EMA | 841.45 | 841.21 | 837.93 | | 20 day EMA | 829.37 | 827.96 | 824.67 | | 35 day EMA | 809.04 | 807.06 | 803.99 | | 50 day EMA | 790.58 | 788.45 | 785.56 |
SMA (simple moving average) of Eldeco Hsg ELDEHSG
| SMA period | SMA current | SMA prev | SMA prev2 | | 5 day SMA | 852.72 | 850.03 | 852.93 | | 12 day SMA | 839.72 | 836.41 | 831.51 | | 20 day SMA | 824.74 | 822.4 | 819.45 | | 35 day SMA | 811.73 | 809.61 | 806.8 | | 50 day SMA | 789.77 | 787.49 | 784.95 | | 100 day SMA | 783.97 | 783.78 | 783.41 | | 150 day SMA | 782.83 | 782.1 | 781.32 | | 200 day SMA | 781.45 | 781.65 | 781.76 |
|
|
