EverestKanto EKC full analysis,charts,indicators,moving averages,SMA,DMA,EMA,ADX,MACD,RSIEverest Kanto EKC WideScreen charts, DMA,SMA,EMA technical analysis, forecast prediction, by indicators ADX,MACD,RSI,CCI NSE stock exchange
operates under Other Industrial Products sector
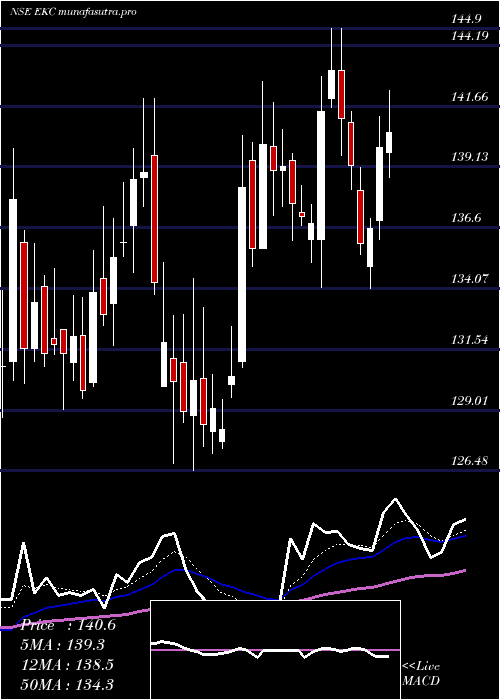
Daily price and charts and targets EverestKanto Strong Daily Stock price targets for EverestKanto EKC are 145.02 and 150.17 | Daily Target 1 | 144 | | Daily Target 2 | 146.04 | | Daily Target 3 | 149.14666666667 | | Daily Target 4 | 151.19 | | Daily Target 5 | 154.3 |
Daily price and volume Everest Kanto
| Date |
Closing |
Open |
Range |
Volume |
Tue 28 October 2025 |
148.09 (-2.28%) |
152.25 |
147.10 - 152.25 |
0.5735 times |
Mon 27 October 2025 |
151.54 (-0.12%) |
152.49 |
150.20 - 154.55 |
0.9562 times |
Fri 24 October 2025 |
151.72 (2.39%) |
148.99 |
148.05 - 153.99 |
2.6858 times |
Thu 23 October 2025 |
148.18 (3.43%) |
143.05 |
142.25 - 150.80 |
2.1204 times |
Tue 21 October 2025 |
143.26 (1.05%) |
142.38 |
141.79 - 143.71 |
0.1964 times |
Mon 20 October 2025 |
141.77 (1.24%) |
141.40 |
139.39 - 142.80 |
0.3917 times |
Fri 17 October 2025 |
140.04 (-2.29%) |
142.85 |
139.20 - 143.30 |
0.6795 times |
Thu 16 October 2025 |
143.32 (0.29%) |
143.80 |
142.65 - 144.74 |
0.4537 times |
Wed 15 October 2025 |
142.91 (1.11%) |
142.05 |
141.12 - 144.30 |
0.9969 times |
Tue 14 October 2025 |
141.34 (1.44%) |
139.10 |
139.00 - 142.80 |
0.9459 times |
Mon 13 October 2025 |
139.34 (-1.02%) |
140.10 |
138.64 - 140.42 |
0.3473 times |
Weekly price and charts EverestKanto Strong weekly Stock price targets for EverestKanto EKC are 143.87 and 151.32 | Weekly Target 1 | 142.46 | | Weekly Target 2 | 145.28 | | Weekly Target 3 | 149.91333333333 | | Weekly Target 4 | 152.73 | | Weekly Target 5 | 157.36 |
Weekly price and volumes for Everest Kanto
| Date |
Closing |
Open |
Range |
Volume |
Tue 28 October 2025 |
148.09 (-2.39%) |
152.49 |
147.10 - 154.55 |
0.3642 times |
Fri 24 October 2025 |
151.72 (8.34%) |
141.40 |
139.39 - 153.99 |
1.2844 times |
Fri 17 October 2025 |
140.04 (-0.52%) |
140.10 |
138.64 - 144.74 |
0.8151 times |
Fri 10 October 2025 |
140.77 (-2.66%) |
145.17 |
139.75 - 146.19 |
0.5599 times |
Fri 03 October 2025 |
144.62 (-0.43%) |
146.00 |
140.61 - 147.95 |
0.8086 times |
Fri 26 September 2025 |
145.25 (3.78%) |
140.20 |
139.15 - 150.97 |
2.5801 times |
Fri 19 September 2025 |
139.96 (0.65%) |
139.45 |
138.59 - 143.57 |
0.8003 times |
Fri 12 September 2025 |
139.06 (-1.21%) |
140.77 |
137.35 - 142.99 |
0.805 times |
Fri 05 September 2025 |
140.76 (2.79%) |
137.10 |
137.10 - 144.00 |
1.0514 times |
Fri 29 August 2025 |
136.94 (-5.16%) |
144.79 |
133.94 - 145.60 |
0.931 times |
Fri 22 August 2025 |
144.39 (-5.61%) |
150.90 |
141.00 - 152.70 |
6.0445 times |
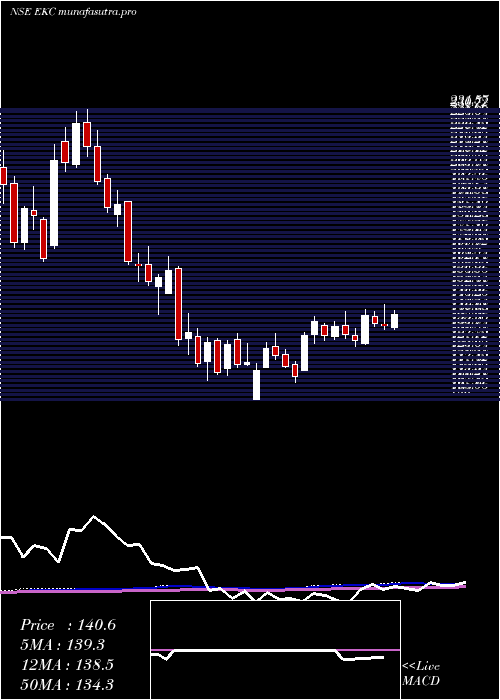
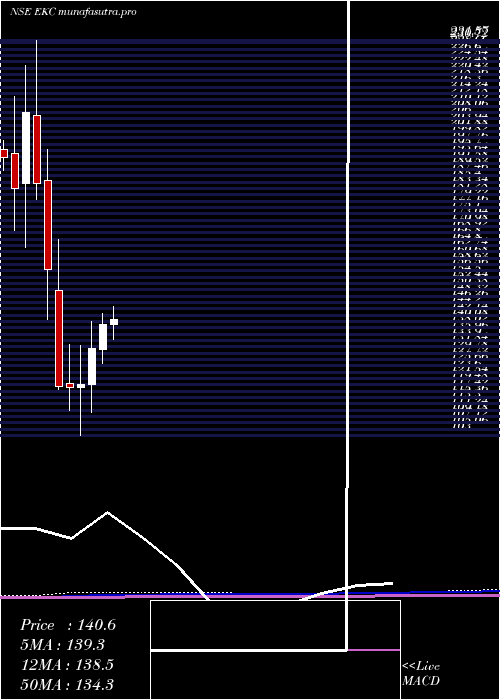
Monthly price and charts EverestKanto Strong monthly Stock price targets for EverestKanto EKC are 143.37 and 159.28 | Monthly Target 1 | 131.18 | | Monthly Target 2 | 139.64 | | Monthly Target 3 | 147.09333333333 | | Monthly Target 4 | 155.55 | | Monthly Target 5 | 163 |
Monthly price and volumes Everest Kanto
| Date |
Closing |
Open |
Range |
Volume |
Tue 28 October 2025 |
148.09 (1.77%) |
145.77 |
138.64 - 154.55 |
0.522 times |
Tue 30 September 2025 |
145.52 (6.27%) |
137.10 |
137.10 - 150.97 |
0.8855 times |
Fri 29 August 2025 |
136.94 (6.34%) |
128.98 |
126.05 - 156.79 |
3.6122 times |
Thu 31 July 2025 |
128.78 (-7.35%) |
138.99 |
125.29 - 144.90 |
0.5461 times |
Mon 30 June 2025 |
138.99 (5.79%) |
131.00 |
126.48 - 142.70 |
0.8278 times |
Fri 30 May 2025 |
131.38 (9.83%) |
119.62 |
110.55 - 139.90 |
0.7239 times |
Wed 30 April 2025 |
119.62 (0.96%) |
118.48 |
103.00 - 132.30 |
0.5691 times |
Fri 28 March 2025 |
118.48 (-0.3%) |
120.00 |
111.23 - 132.44 |
0.6762 times |
Fri 28 February 2025 |
118.84 (-24.26%) |
150.00 |
117.80 - 166.60 |
0.6083 times |
Fri 31 January 2025 |
156.91 (-15.15%) |
185.80 |
140.77 - 195.87 |
1.0289 times |
Tue 31 December 2024 |
184.93 (-11.15%) |
207.00 |
179.64 - 231.57 |
1.6599 times |
DMA SMA EMA moving averages of Everest Kanto EKC
DMA (daily moving average) of Everest Kanto EKC
| DMA period | DMA value | | 5 day DMA | 148.56 | | 12 day DMA | 144.36 | | 20 day DMA | 143.94 | | 35 day DMA | 143.12 | | 50 day DMA | 142.65 | | 100 day DMA | 138.54 | | 150 day DMA | 133.94 | | 200 day DMA | 136.3 | EMA (exponential moving average) of Everest Kanto EKC
| EMA period | EMA current | EMA prev | EMA prev2 | | 5 day EMA | 148.23 | 148.3 | 146.68 | | 12 day EMA | 145.92 | 145.52 | 144.42 | | 20 day EMA | 144.71 | 144.35 | 143.59 | | 35 day EMA | 143.21 | 142.92 | 142.41 | | 50 day EMA | 142.34 | 142.11 | 141.73 |
SMA (simple moving average) of Everest Kanto EKC
| SMA period | SMA current | SMA prev | SMA prev2 | | 5 day SMA | 148.56 | 147.29 | 144.99 | | 12 day SMA | 144.36 | 143.87 | 142.99 | | 20 day SMA | 143.94 | 143.8 | 143.7 | | 35 day SMA | 143.12 | 142.92 | 142.59 | | 50 day SMA | 142.65 | 142.31 | 141.94 | | 100 day SMA | 138.54 | 138.39 | 138.18 | | 150 day SMA | 133.94 | 133.79 | 133.58 | | 200 day SMA | 136.3 | 136.45 | 136.64 |
|
|
