EidParry EIDPARRY full analysis,charts,indicators,moving averages,SMA,DMA,EMA,ADX,MACD,RSIEid Parry EIDPARRY WideScreen charts, DMA,SMA,EMA technical analysis, forecast prediction, by indicators ADX,MACD,RSI,CCI NSE stock exchange
operates under Sugar sector
Daily price and charts and targets EidParry Strong Daily Stock price targets for EidParry EIDPARRY are 1065.1 and 1123.3 | Daily Target 1 | 1024.53 | | Daily Target 2 | 1047.47 | | Daily Target 3 | 1082.7333333333 | | Daily Target 4 | 1105.67 | | Daily Target 5 | 1140.93 |
Daily price and volume Eid Parry
| Date |
Closing |
Open |
Range |
Volume |
Tue 28 October 2025 |
1070.40 (0.4%) |
1066.00 |
1059.80 - 1118.00 |
3.7273 times |
Mon 27 October 2025 |
1066.10 (2.63%) |
1040.00 |
1033.30 - 1078.40 |
1.2836 times |
Fri 24 October 2025 |
1038.80 (-0.42%) |
1048.40 |
1029.30 - 1051.50 |
0.5696 times |
Thu 23 October 2025 |
1043.20 (0.38%) |
1039.20 |
1031.70 - 1059.50 |
0.9348 times |
Tue 21 October 2025 |
1039.20 (1.03%) |
1033.40 |
1028.10 - 1044.00 |
0.1112 times |
Mon 20 October 2025 |
1028.60 (0.63%) |
1027.00 |
1011.50 - 1033.30 |
0.6965 times |
Fri 17 October 2025 |
1022.20 (-0.91%) |
1032.30 |
1013.90 - 1032.30 |
0.7692 times |
Thu 16 October 2025 |
1031.60 (-0.27%) |
1034.40 |
1021.00 - 1043.90 |
0.4652 times |
Wed 15 October 2025 |
1034.40 (-0.43%) |
1038.90 |
1025.50 - 1043.90 |
0.8268 times |
Tue 14 October 2025 |
1038.90 (0.28%) |
1040.80 |
1030.00 - 1045.00 |
0.6158 times |
Mon 13 October 2025 |
1036.00 (0.93%) |
1026.50 |
1020.30 - 1051.00 |
1.1274 times |
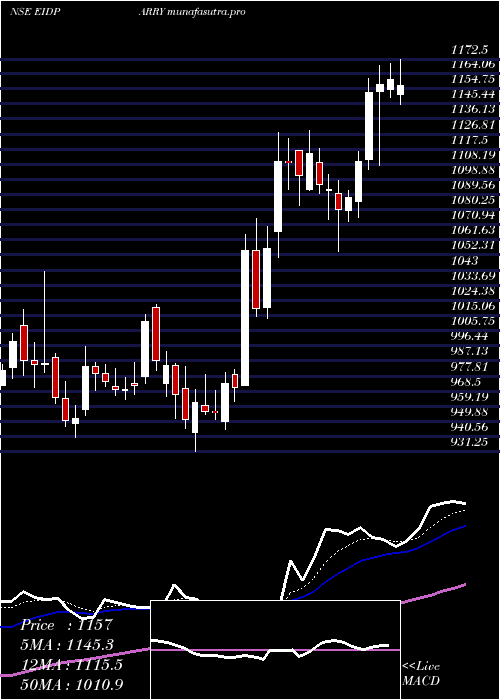
Weekly price and charts EidParry Strong weekly Stock price targets for EidParry EIDPARRY are 1051.85 and 1136.55 | Weekly Target 1 | 989.2 | | Weekly Target 2 | 1029.8 | | Weekly Target 3 | 1073.9 | | Weekly Target 4 | 1114.5 | | Weekly Target 5 | 1158.6 |
Weekly price and volumes for Eid Parry
| Date |
Closing |
Open |
Range |
Volume |
Tue 28 October 2025 |
1070.40 (3.04%) |
1040.00 |
1033.30 - 1118.00 |
1.0468 times |
Fri 24 October 2025 |
1038.80 (1.62%) |
1027.00 |
1011.50 - 1059.50 |
0.483 times |
Fri 17 October 2025 |
1022.20 (-0.42%) |
1026.50 |
1013.90 - 1051.00 |
0.7948 times |
Fri 10 October 2025 |
1026.50 (-1.48%) |
1047.00 |
1021.30 - 1064.90 |
0.8517 times |
Fri 03 October 2025 |
1041.90 (1%) |
1028.50 |
998.80 - 1046.50 |
0.939 times |
Fri 26 September 2025 |
1031.60 (-3.25%) |
1060.00 |
1028.10 - 1078.00 |
0.7371 times |
Fri 19 September 2025 |
1066.30 (-0.59%) |
1068.00 |
1060.10 - 1104.00 |
1.0712 times |
Fri 12 September 2025 |
1072.60 (-3.61%) |
1112.80 |
1060.00 - 1119.00 |
1.2353 times |
Fri 05 September 2025 |
1112.80 (-1.15%) |
1105.00 |
1097.60 - 1176.00 |
1.7065 times |
Fri 29 August 2025 |
1125.80 (-4.43%) |
1169.90 |
1101.60 - 1196.40 |
1.1346 times |
Fri 22 August 2025 |
1178.00 (1.32%) |
1168.50 |
1135.50 - 1185.00 |
0.932 times |
Monthly price and charts EidParry Strong monthly Stock price targets for EidParry EIDPARRY are 1040.95 and 1147.45 | Monthly Target 1 | 960.13 | | Monthly Target 2 | 1015.27 | | Monthly Target 3 | 1066.6333333333 | | Monthly Target 4 | 1121.77 | | Monthly Target 5 | 1173.13 |
Monthly price and volumes Eid Parry
| Date |
Closing |
Open |
Range |
Volume |
Tue 28 October 2025 |
1070.40 (4.38%) |
1028.90 |
1011.50 - 1118.00 |
0.4803 times |
Tue 30 September 2025 |
1025.50 (-8.91%) |
1105.00 |
998.80 - 1176.00 |
0.7534 times |
Fri 29 August 2025 |
1125.80 (-8.73%) |
1233.50 |
1052.00 - 1246.10 |
1.0931 times |
Thu 31 July 2025 |
1233.50 (11.13%) |
1110.00 |
1054.60 - 1246.80 |
1.2213 times |
Mon 30 June 2025 |
1110.00 (16.82%) |
948.70 |
931.25 - 1127.95 |
1.4917 times |
Fri 30 May 2025 |
950.15 (16.25%) |
822.60 |
815.20 - 1042.00 |
1.1723 times |
Wed 30 April 2025 |
817.35 (4.04%) |
773.80 |
696.65 - 877.00 |
0.7615 times |
Fri 28 March 2025 |
785.60 (18.3%) |
660.00 |
639.00 - 799.90 |
1.0476 times |
Fri 28 February 2025 |
664.10 (-19%) |
807.00 |
657.20 - 869.00 |
1.1713 times |
Fri 31 January 2025 |
819.90 (-8.25%) |
893.65 |
753.15 - 929.50 |
0.8076 times |
Tue 31 December 2024 |
893.65 (4.2%) |
849.10 |
849.10 - 997.00 |
3.104 times |
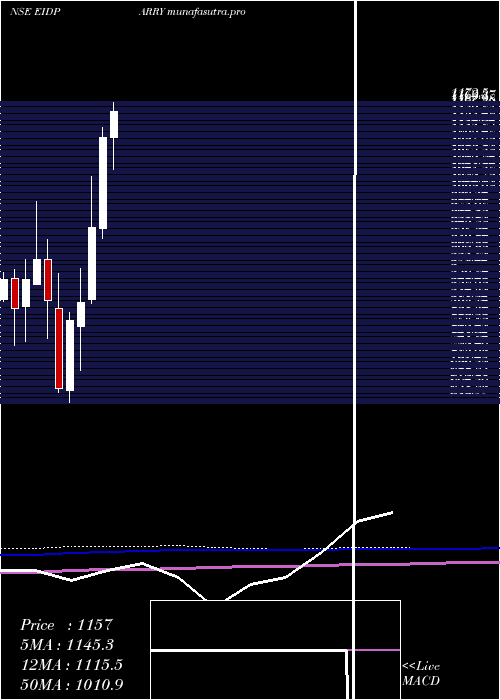
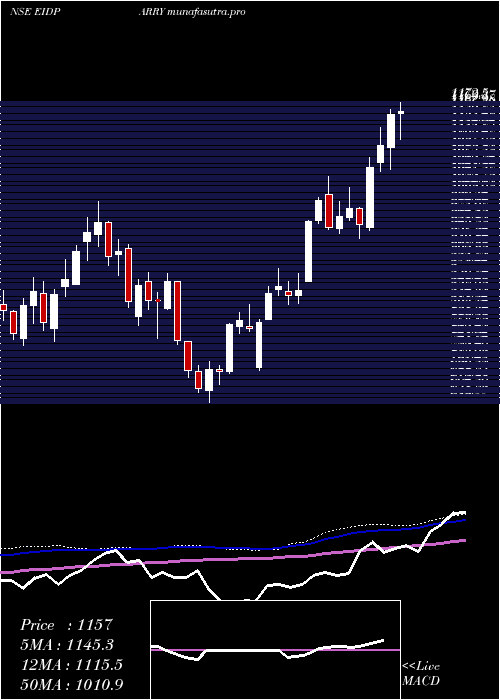
DMA SMA EMA moving averages of Eid Parry EIDPARRY
DMA (daily moving average) of Eid Parry EIDPARRY
| DMA period | DMA value | | 5 day DMA | 1051.54 | | 12 day DMA | 1039.66 | | 20 day DMA | 1038.79 | | 35 day DMA | 1053.83 | | 50 day DMA | 1080.61 | | 100 day DMA | 1088.33 | | 150 day DMA | 1013.78 | | 200 day DMA | 953.01 | EMA (exponential moving average) of Eid Parry EIDPARRY
| EMA period | EMA current | EMA prev | EMA prev2 | | 5 day EMA | 1054.7 | 1046.85 | 1037.23 | | 12 day EMA | 1046.52 | 1042.18 | 1037.83 | | 20 day EMA | 1048.59 | 1046.29 | 1044.21 | | 35 day EMA | 1064.02 | 1063.64 | 1063.5 | | 50 day EMA | 1082.97 | 1083.48 | 1084.19 |
SMA (simple moving average) of Eid Parry EIDPARRY
| SMA period | SMA current | SMA prev | SMA prev2 | | 5 day SMA | 1051.54 | 1043.18 | 1034.4 | | 12 day SMA | 1039.66 | 1036.9 | 1036.1 | | 20 day SMA | 1038.79 | 1036.85 | 1036.63 | | 35 day SMA | 1053.83 | 1055.04 | 1056.74 | | 50 day SMA | 1080.61 | 1081.97 | 1084.01 | | 100 day SMA | 1088.33 | 1087.42 | 1086.59 | | 150 day SMA | 1013.78 | 1011.72 | 1009.55 | | 200 day SMA | 953.01 | 952.06 | 951.27 |
|
|
