EffwaInfra EFFWA_SM full analysis,charts,indicators,moving averages,SMA,DMA,EMA,ADX,MACD,RSIEffwa Infra EFFWA_SM WideScreen charts, DMA,SMA,EMA technical analysis, forecast prediction, by indicators ADX,MACD,RSI,CCI NSE stock exchange
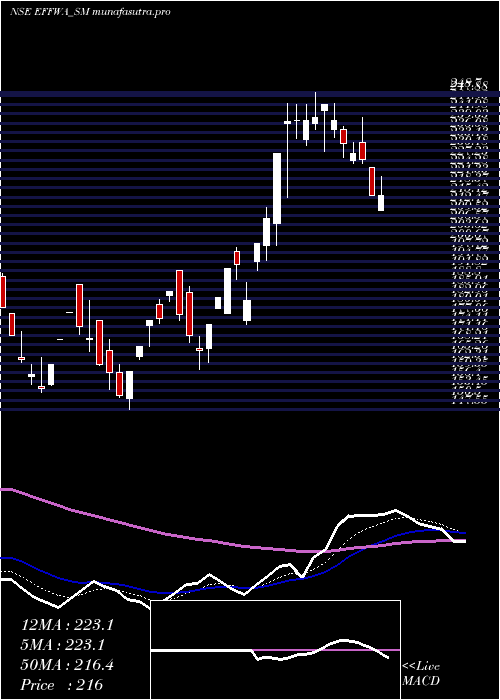
Daily price and charts and targets EffwaInfra Strong Daily Stock price targets for EffwaInfra EFFWA_SM are 205.9 and 214 | Daily Target 1 | 199.78 | | Daily Target 2 | 203.92 | | Daily Target 3 | 207.88333333333 | | Daily Target 4 | 212.02 | | Daily Target 5 | 215.98 |
Daily price and volume Effwa Infra
| Date |
Closing |
Open |
Range |
Volume |
Tue 28 October 2025 |
208.05 (2.21%) |
205.00 |
203.75 - 211.85 |
0.5418 times |
Mon 27 October 2025 |
203.55 (-2.58%) |
208.95 |
203.00 - 213.75 |
0.6464 times |
Fri 24 October 2025 |
208.95 (-0.21%) |
209.95 |
205.25 - 215.00 |
0.6844 times |
Thu 23 October 2025 |
209.40 (-0.5%) |
216.95 |
206.90 - 219.15 |
0.5894 times |
Tue 21 October 2025 |
210.45 (-0.64%) |
208.00 |
208.00 - 211.95 |
0.3802 times |
Mon 20 October 2025 |
211.80 (3.22%) |
205.30 |
205.20 - 212.00 |
0.3802 times |
Fri 17 October 2025 |
205.20 (-4.76%) |
187.00 |
187.00 - 215.90 |
4.7053 times |
Thu 16 October 2025 |
215.45 (0.21%) |
219.00 |
213.50 - 222.00 |
0.3517 times |
Wed 15 October 2025 |
215.00 (0%) |
215.00 |
215.00 - 221.00 |
0.1996 times |
Tue 14 October 2025 |
215.00 (2.04%) |
209.35 |
208.00 - 217.50 |
1.5209 times |
Mon 13 October 2025 |
210.70 (-4.75%) |
218.00 |
200.00 - 218.00 |
2.8802 times |
Weekly price and charts EffwaInfra Strong weekly Stock price targets for EffwaInfra EFFWA_SM are 200.15 and 210.9 | Weekly Target 1 | 197.52 | | Weekly Target 2 | 202.78 | | Weekly Target 3 | 208.26666666667 | | Weekly Target 4 | 213.53 | | Weekly Target 5 | 219.02 |
Weekly price and volumes for Effwa Infra
| Date |
Closing |
Open |
Range |
Volume |
Tue 28 October 2025 |
208.05 (-0.43%) |
208.95 |
203.00 - 213.75 |
0.3588 times |
Fri 24 October 2025 |
208.95 (1.83%) |
205.30 |
205.20 - 219.15 |
0.6142 times |
Fri 17 October 2025 |
205.20 (-7.23%) |
218.00 |
187.00 - 222.00 |
2.9162 times |
Fri 10 October 2025 |
221.20 (-1.38%) |
224.30 |
217.30 - 227.65 |
0.3645 times |
Fri 03 October 2025 |
224.30 (4.69%) |
210.00 |
210.00 - 230.00 |
0.4679 times |
Fri 26 September 2025 |
214.25 (-11.1%) |
232.00 |
204.05 - 233.40 |
0.8439 times |
Thu 19 June 2025 |
241.00 (2.79%) |
234.45 |
231.35 - 247.00 |
0.6602 times |
Fri 13 June 2025 |
234.45 (-6.18%) |
259.90 |
231.15 - 259.90 |
1.3375 times |
Fri 06 June 2025 |
249.90 (8.39%) |
225.50 |
223.40 - 261.60 |
1.837 times |
Fri 30 May 2025 |
230.55 (-4.16%) |
240.00 |
220.30 - 243.00 |
0.5999 times |
Fri 23 May 2025 |
240.55 (2.73%) |
232.00 |
223.00 - 245.00 |
0.841 times |
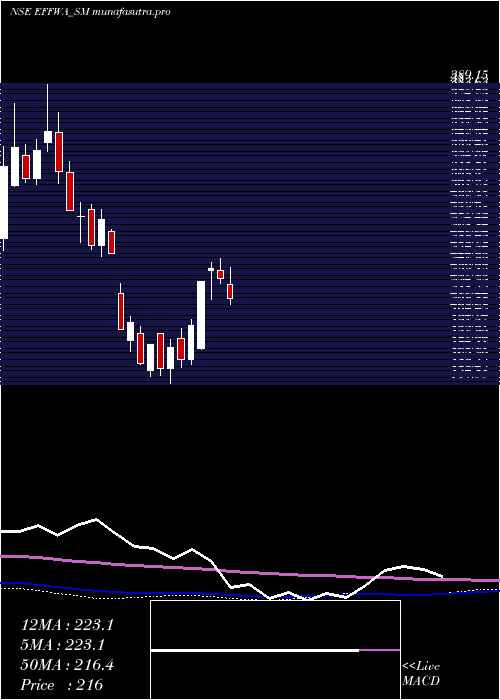
Monthly price and charts EffwaInfra Strong monthly Stock price targets for EffwaInfra EFFWA_SM are 177.2 and 217.85 | Monthly Target 1 | 166.92 | | Monthly Target 2 | 187.48 | | Monthly Target 3 | 207.56666666667 | | Monthly Target 4 | 228.13 | | Monthly Target 5 | 248.22 |
Monthly price and volumes Effwa Infra
| Date |
Closing |
Open |
Range |
Volume |
Tue 28 October 2025 |
208.05 (-7.22%) |
227.50 |
187.00 - 227.65 |
0.3103 times |
Tue 30 September 2025 |
224.25 (-6.95%) |
232.00 |
204.05 - 233.40 |
0.0861 times |
Thu 19 June 2025 |
241.00 (4.53%) |
225.50 |
223.40 - 261.60 |
0.2731 times |
Fri 30 May 2025 |
230.55 (6.71%) |
211.25 |
206.10 - 245.00 |
0.3872 times |
Wed 30 April 2025 |
216.05 (29.88%) |
167.00 |
162.50 - 248.70 |
0.6038 times |
Fri 28 March 2025 |
166.35 (1.65%) |
158.10 |
147.55 - 191.80 |
0.8857 times |
Fri 28 February 2025 |
163.65 (-35.16%) |
220.00 |
162.70 - 228.00 |
0.3878 times |
Tue 08 October 2024 |
252.40 (-0.57%) |
254.00 |
249.95 - 287.90 |
0.3074 times |
Mon 30 September 2024 |
253.85 (-27.73%) |
350.00 |
249.95 - 366.45 |
1.9934 times |
Fri 30 August 2024 |
351.25 (5.12%) |
332.05 |
301.60 - 389.15 |
4.7652 times |
Wed 31 July 2024 |
334.15 (0%) |
264.90 |
254.90 - 337.25 |
2.7318 times |

DMA SMA EMA moving averages of Effwa Infra EFFWA_SM
DMA (daily moving average) of Effwa Infra EFFWA_SM
| DMA period | DMA value | | 5 day DMA | 208.08 | | 12 day DMA | 211.23 | | 20 day DMA | 215.59 | | 35 day DMA | 224.55 | | 50 day DMA | 226.73 | | 100 day DMA | 211.9 | | 150 day DMA | 235.45 | | 200 day DMA | | EMA (exponential moving average) of Effwa Infra EFFWA_SM
| EMA period | EMA current | EMA prev | EMA prev2 | | 5 day EMA | 208.02 | 208.01 | 210.24 | | 12 day EMA | 211.38 | 211.99 | 213.52 | | 20 day EMA | 214.97 | 215.7 | 216.98 | | 35 day EMA | 219.79 | 220.48 | 221.48 | | 50 day EMA | 224.73 | 225.41 | 226.3 |
SMA (simple moving average) of Effwa Infra EFFWA_SM
| SMA period | SMA current | SMA prev | SMA prev2 | | 5 day SMA | 208.08 | 208.83 | 209.16 | | 12 day SMA | 211.23 | 212.25 | 213.9 | | 20 day SMA | 215.59 | 215.9 | 216.64 | | 35 day SMA | 224.55 | 225.37 | 226.06 | | 50 day SMA | 226.73 | 227.42 | 228.01 | | 100 day SMA | 211.9 | 211.78 | 211.67 | | 150 day SMA | 235.45 | 236.31 | 237.1 | | 200 day SMA |
|
|
