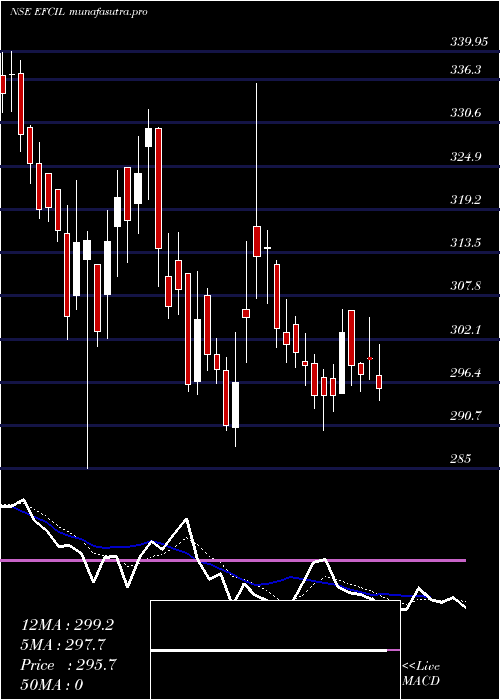
EfcI EFCIL full analysis,charts,indicators,moving averages,SMA,DMA,EMA,ADX,MACD,RSIEfc I EFCIL WideScreen charts, DMA,SMA,EMA technical analysis, forecast prediction, by indicators ADX,MACD,RSI,CCI NSE stock exchange
Daily price and charts and targets EfcI Strong Daily Stock price targets for EfcI EFCIL are 294.13 and 302.23 | Daily Target 1 | 292.32 | | Daily Target 2 | 295.93 | | Daily Target 3 | 300.41666666667 | | Daily Target 4 | 304.03 | | Daily Target 5 | 308.52 |
Daily price and volume Efc I
| Date |
Closing |
Open |
Range |
Volume |
Tue 28 October 2025 |
299.55 (0.71%) |
299.60 |
296.80 - 304.90 |
1.3271 times |
Mon 27 October 2025 |
297.45 (-0.4%) |
298.90 |
295.20 - 299.00 |
0.3305 times |
Fri 24 October 2025 |
298.65 (-1.44%) |
305.90 |
296.00 - 305.90 |
0.469 times |
Thu 23 October 2025 |
303.00 (2.82%) |
295.00 |
295.00 - 305.95 |
1.2013 times |
Tue 21 October 2025 |
294.70 (0.02%) |
296.95 |
292.60 - 298.80 |
0.6423 times |
Mon 20 October 2025 |
294.65 (-0.02%) |
297.00 |
290.00 - 298.05 |
0.8114 times |
Fri 17 October 2025 |
294.70 (-1.29%) |
298.85 |
293.00 - 300.05 |
0.9408 times |
Thu 16 October 2025 |
298.55 (-0.62%) |
299.20 |
296.00 - 302.85 |
1.1807 times |
Wed 15 October 2025 |
300.40 (-0.33%) |
304.00 |
298.35 - 305.05 |
1.0726 times |
Tue 14 October 2025 |
301.40 (-0.71%) |
303.00 |
299.05 - 307.25 |
2.0244 times |
Mon 13 October 2025 |
303.55 (-3.39%) |
311.90 |
301.00 - 312.40 |
1.3317 times |

Weekly price and charts EfcI Strong weekly Stock price targets for EfcI EFCIL are 297.38 and 307.08 | Weekly Target 1 | 290.18 | | Weekly Target 2 | 294.87 | | Weekly Target 3 | 299.88333333333 | | Weekly Target 4 | 304.57 | | Weekly Target 5 | 309.58 |
Weekly price and volumes for Efc I
| Date |
Closing |
Open |
Range |
Volume |
Tue 28 October 2025 |
299.55 (0.3%) |
298.90 |
295.20 - 304.90 |
0.1676 times |
Fri 24 October 2025 |
298.65 (1.34%) |
297.00 |
290.00 - 305.95 |
0.316 times |
Fri 17 October 2025 |
294.70 (-6.21%) |
311.90 |
293.00 - 312.40 |
0.6625 times |
Fri 10 October 2025 |
314.20 (5.4%) |
298.00 |
287.90 - 335.85 |
3.2204 times |
Fri 03 October 2025 |
298.10 (-3.4%) |
310.80 |
294.75 - 311.00 |
0.6171 times |
Fri 26 September 2025 |
308.60 (-2.88%) |
319.95 |
304.85 - 332.35 |
1.7438 times |
Fri 19 September 2025 |
317.75 (0.94%) |
312.55 |
285.00 - 324.70 |
2.0841 times |
Fri 12 September 2025 |
314.80 (-3.21%) |
325.25 |
302.05 - 328.00 |
0.6817 times |
Fri 05 September 2025 |
325.25 (-3.81%) |
342.00 |
322.65 - 342.00 |
0.2657 times |
Fri 29 August 2025 |
338.15 (0%) |
338.85 |
324.20 - 341.00 |
0.241 times |
Wed 29 October 2025 |
(0%) |
|
- |
0 times |

Monthly price and charts EfcI Strong monthly Stock price targets for EfcI EFCIL are 269.75 and 317.7 | Monthly Target 1 | 259.82 | | Monthly Target 2 | 279.68 | | Monthly Target 3 | 307.76666666667 | | Monthly Target 4 | 327.63 | | Monthly Target 5 | 355.72 |
Monthly price and volumes Efc I
| Date |
Closing |
Open |
Range |
Volume |
Tue 28 October 2025 |
299.55 (-1.71%) |
307.80 |
287.90 - 335.85 |
1.3217 times |
Tue 30 September 2025 |
304.75 (-9.88%) |
342.00 |
285.00 - 342.00 |
1.5413 times |
Fri 29 August 2025 |
338.15 (0%) |
347.70 |
324.20 - 357.00 |
0.137 times |
Wed 29 October 2025 |
(0%) |
|
- |
0 times |

DMA SMA EMA moving averages of Efc I EFCIL
DMA (daily moving average) of Efc I EFCIL
| DMA period | DMA value | | 5 day DMA | 298.67 | | 12 day DMA | 300.07 | | 20 day DMA | 300.24 | | 35 day DMA | 306.69 | | 50 day DMA | | | 100 day DMA | | | 150 day DMA | | | 200 day DMA | | EMA (exponential moving average) of Efc I EFCIL
| EMA period | EMA current | EMA prev | EMA prev2 | | 5 day EMA | 298.74 | 298.33 | 298.77 | | 12 day EMA | 299.86 | 299.92 | 300.37 | | 20 day EMA | 302.56 | 302.88 | 303.45 | | 35 day EMA | 309.12 | 309.68 | 310.4 | | 50 day EMA | 0 | 0 | 0 |
SMA (simple moving average) of Efc I EFCIL
| SMA period | SMA current | SMA prev | SMA prev2 | | 5 day SMA | 298.67 | 297.69 | 297.14 | | 12 day SMA | 300.07 | 301.18 | 301.81 | | 20 day SMA | 300.24 | 300.69 | 301.14 | | 35 day SMA | 306.69 | 307.43 | 308.33 | | 50 day SMA | | 100 day SMA | | 150 day SMA | | 200 day SMA |
|
|
