EFactor EFACTOR_SM full analysis,charts,indicators,moving averages,SMA,DMA,EMA,ADX,MACD,RSIE Factor EFACTOR_SM WideScreen charts, DMA,SMA,EMA technical analysis, forecast prediction, by indicators ADX,MACD,RSI,CCI NSE stock exchange
Daily price and charts and targets EFactor Strong Daily Stock price targets for EFactor EFACTOR_SM are 315.15 and 335.15 | Daily Target 1 | 300.43 | | Daily Target 2 | 309.87 | | Daily Target 3 | 320.43333333333 | | Daily Target 4 | 329.87 | | Daily Target 5 | 340.43 |
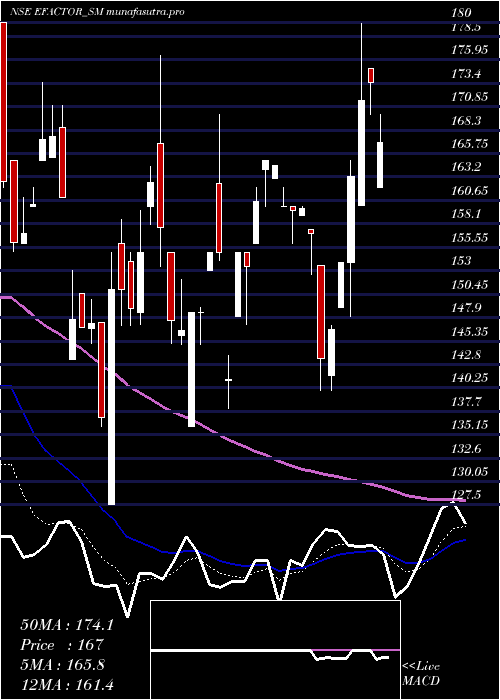
Daily price and volume E Factor
| Date |
Closing |
Open |
Range |
Volume |
Wed 29 October 2025 |
319.30 (3.38%) |
312.00 |
311.00 - 331.00 |
2.3684 times |
Tue 28 October 2025 |
308.85 (7.37%) |
300.00 |
300.00 - 318.00 |
2.3421 times |
Mon 27 October 2025 |
287.65 (0.93%) |
285.50 |
285.30 - 294.60 |
0.1579 times |
Fri 24 October 2025 |
285.00 (-0.54%) |
290.00 |
285.00 - 290.00 |
0.0526 times |
Thu 23 October 2025 |
286.55 (-4.04%) |
294.95 |
283.10 - 294.95 |
0.2105 times |
Tue 21 October 2025 |
298.60 (4.77%) |
305.00 |
296.95 - 305.00 |
0.1579 times |
Mon 20 October 2025 |
285.00 (1.79%) |
300.00 |
279.00 - 300.00 |
0.1842 times |
Fri 17 October 2025 |
280.00 (-4.39%) |
295.10 |
278.00 - 295.10 |
0.3421 times |
Thu 16 October 2025 |
292.85 (-3.19%) |
308.90 |
291.80 - 311.55 |
1.1053 times |
Wed 15 October 2025 |
302.50 (19.99%) |
262.00 |
262.00 - 302.50 |
3.0789 times |
Tue 14 October 2025 |
252.10 (-7.62%) |
261.60 |
250.10 - 261.60 |
0.3421 times |
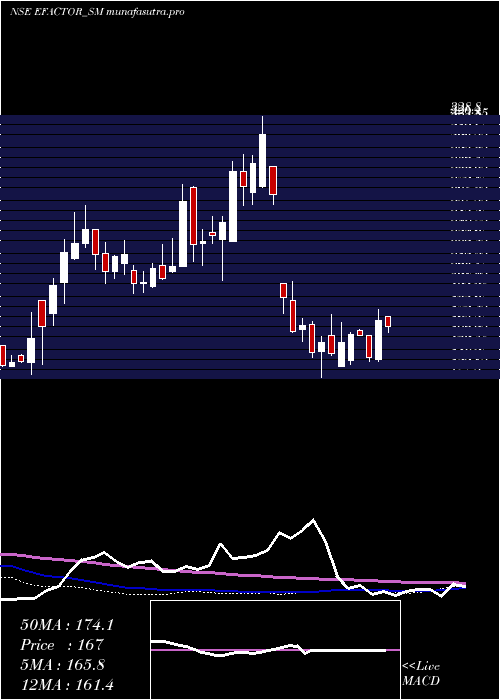
Weekly price and charts EFactor Strong weekly Stock price targets for EFactor EFACTOR_SM are 302.3 and 348 | Weekly Target 1 | 266.17 | | Weekly Target 2 | 292.73 | | Weekly Target 3 | 311.86666666667 | | Weekly Target 4 | 338.43 | | Weekly Target 5 | 357.57 |
Weekly price and volumes for E Factor
| Date |
Closing |
Open |
Range |
Volume |
Wed 29 October 2025 |
319.30 (12.04%) |
285.50 |
285.30 - 331.00 |
1.8593 times |
Fri 24 October 2025 |
285.00 (1.79%) |
300.00 |
279.00 - 305.00 |
0.2312 times |
Fri 17 October 2025 |
280.00 (0%) |
277.00 |
250.10 - 311.55 |
1.9095 times |
Fri 10 October 2025 |
280.00 (-2.69%) |
288.60 |
276.00 - 294.90 |
0.3719 times |
Fri 03 October 2025 |
287.75 (8.58%) |
266.00 |
261.10 - 289.00 |
0.593 times |
Fri 26 September 2025 |
265.00 (-3.02%) |
273.00 |
255.00 - 280.00 |
0.6834 times |
Fri 19 September 2025 |
273.25 (1.56%) |
282.00 |
253.05 - 282.00 |
0.3518 times |
Fri 12 September 2025 |
269.05 (30.67%) |
230.00 |
221.00 - 285.00 |
2.5427 times |
Tue 03 June 2025 |
205.90 (-5.55%) |
200.00 |
198.50 - 213.00 |
0.5025 times |
Fri 30 May 2025 |
218.00 (2.11%) |
222.00 |
210.00 - 233.00 |
0.9548 times |
Fri 23 May 2025 |
213.50 (-0.56%) |
225.00 |
196.00 - 225.00 |
1.1256 times |
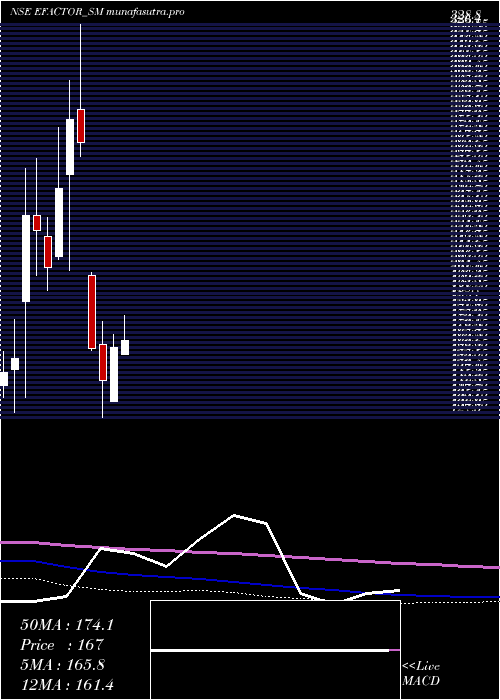
Monthly price and charts EFactor Strong monthly Stock price targets for EFactor EFACTOR_SM are 284.7 and 365.6 | Monthly Target 1 | 219.23 | | Monthly Target 2 | 269.27 | | Monthly Target 3 | 300.13333333333 | | Monthly Target 4 | 350.17 | | Monthly Target 5 | 381.03 |
Monthly price and volumes E Factor
| Date |
Closing |
Open |
Range |
Volume |
Wed 29 October 2025 |
319.30 (20.49%) |
267.00 |
250.10 - 331.00 |
0.9031 times |
Tue 30 September 2025 |
265.00 (28.7%) |
230.00 |
221.00 - 285.00 |
0.6928 times |
Tue 03 June 2025 |
205.90 (-5.55%) |
200.00 |
198.50 - 213.00 |
0.0939 times |
Fri 30 May 2025 |
218.00 (33.58%) |
160.05 |
160.05 - 233.00 |
1.2017 times |
Wed 30 April 2025 |
163.20 (11.4%) |
136.00 |
136.00 - 170.00 |
0.5107 times |
Fri 28 March 2025 |
146.50 (-9.98%) |
165.00 |
127.50 - 176.45 |
1.1528 times |
Fri 28 February 2025 |
162.75 (-39.33%) |
200.00 |
162.05 - 201.90 |
0.3286 times |
Mon 11 November 2024 |
268.25 (-4.2%) |
285.00 |
261.00 - 328.80 |
1.0364 times |
Thu 31 October 2024 |
280.00 (14.33%) |
251.85 |
202.65 - 299.70 |
1.5715 times |
Mon 30 September 2024 |
244.90 (19.93%) |
209.70 |
208.30 - 276.00 |
2.5084 times |
Fri 30 August 2024 |
204.20 (-8.57%) |
220.10 |
192.50 - 229.95 |
0.7754 times |
DMA SMA EMA moving averages of E Factor EFACTOR_SM
DMA (daily moving average) of E Factor EFACTOR_SM
| DMA period | DMA value | | 5 day DMA | 297.47 | | 12 day DMA | 289.28 | | 20 day DMA | 285.4 | | 35 day DMA | 275.91 | | 50 day DMA | 255.93 | | 100 day DMA | 208.7 | | 150 day DMA | 223.61 | | 200 day DMA | 222.04 | EMA (exponential moving average) of E Factor EFACTOR_SM
| EMA period | EMA current | EMA prev | EMA prev2 | | 5 day EMA | 302.73 | 294.44 | 287.24 | | 12 day EMA | 293.02 | 288.24 | 284.49 | | 20 day EMA | 285.47 | 281.91 | 279.07 | | 35 day EMA | 269.07 | 266.11 | 263.59 | | 50 day EMA | 253.57 | 250.89 | 248.53 |
SMA (simple moving average) of E Factor EFACTOR_SM
| SMA period | SMA current | SMA prev | SMA prev2 | | 5 day SMA | 297.47 | 293.33 | 288.56 | | 12 day SMA | 289.28 | 286 | 284.19 | | 20 day SMA | 285.4 | 282.69 | 280.5 | | 35 day SMA | 275.91 | 272.67 | 269.7 | | 50 day SMA | 255.93 | 253.22 | 250.76 | | 100 day SMA | 208.7 | 207.45 | 206.28 | | 150 day SMA | 223.61 | 222.94 | 222.3 | | 200 day SMA | 222.04 | 221.56 | 221.13 |
|
|
