GngElectronics EBGNG full analysis,charts,indicators,moving averages,SMA,DMA,EMA,ADX,MACD,RSIGng Electronics EBGNG WideScreen charts, DMA,SMA,EMA technical analysis, forecast prediction, by indicators ADX,MACD,RSI,CCI NSE stock exchange
Daily price and charts and targets GngElectronics Strong Daily Stock price targets for GngElectronics EBGNG are 322.8 and 328.45 | Daily Target 1 | 318.47 | | Daily Target 2 | 321.48 | | Daily Target 3 | 324.11666666667 | | Daily Target 4 | 327.13 | | Daily Target 5 | 329.77 |
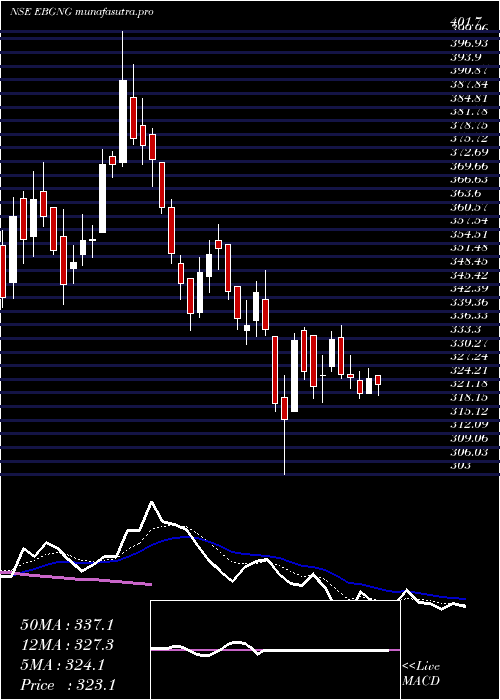
Daily price and volume Gng Electronics
| Date |
Closing |
Open |
Range |
Volume |
Tue 28 October 2025 |
324.50 (1.07%) |
321.10 |
321.10 - 326.75 |
0.5348 times |
Mon 27 October 2025 |
321.05 (-1.12%) |
324.00 |
320.00 - 325.95 |
0.6001 times |
Fri 24 October 2025 |
324.70 (-0.17%) |
325.25 |
322.10 - 329.45 |
0.7683 times |
Thu 23 October 2025 |
325.25 (-2.36%) |
333.60 |
324.50 - 336.20 |
0.7969 times |
Tue 21 October 2025 |
333.10 (2.49%) |
327.05 |
325.95 - 334.95 |
0.4877 times |
Mon 20 October 2025 |
325.00 (0.73%) |
325.00 |
319.05 - 329.50 |
0.6282 times |
Fri 17 October 2025 |
322.65 (-1%) |
334.00 |
320.00 - 334.00 |
0.7692 times |
Thu 16 October 2025 |
325.90 (-2.07%) |
335.00 |
324.25 - 335.75 |
1.1617 times |
Wed 15 October 2025 |
332.80 (5.57%) |
317.00 |
317.00 - 334.50 |
2.5267 times |
Tue 14 October 2025 |
315.25 (-1.14%) |
320.10 |
303.00 - 325.00 |
1.7264 times |
Mon 13 October 2025 |
318.90 (-4.86%) |
333.80 |
317.00 - 333.80 |
1.5177 times |
Weekly price and charts GngElectronics Strong weekly Stock price targets for GngElectronics EBGNG are 322.25 and 329 | Weekly Target 1 | 317 | | Weekly Target 2 | 320.75 | | Weekly Target 3 | 323.75 | | Weekly Target 4 | 327.5 | | Weekly Target 5 | 330.5 |
Weekly price and volumes for Gng Electronics
| Date |
Closing |
Open |
Range |
Volume |
Tue 28 October 2025 |
324.50 (-0.06%) |
324.00 |
320.00 - 326.75 |
0.1001 times |
Fri 24 October 2025 |
324.70 (0.64%) |
325.00 |
319.05 - 336.20 |
0.2366 times |
Fri 17 October 2025 |
322.65 (-3.74%) |
333.80 |
303.00 - 335.75 |
0.6796 times |
Fri 10 October 2025 |
335.20 (-5.12%) |
354.30 |
332.00 - 354.30 |
0.4523 times |
Fri 03 October 2025 |
353.30 (2.26%) |
346.75 |
335.00 - 358.65 |
0.454 times |
Fri 26 September 2025 |
345.50 (-8.57%) |
380.70 |
342.00 - 386.70 |
0.6142 times |
Fri 19 September 2025 |
377.90 (6.42%) |
355.00 |
351.30 - 401.70 |
1.8116 times |
Fri 12 September 2025 |
355.10 (-2.51%) |
365.95 |
340.95 - 372.40 |
0.8977 times |
Fri 05 September 2025 |
364.25 (6.57%) |
345.80 |
339.15 - 370.40 |
1.5683 times |
Fri 29 August 2025 |
341.80 (-0.88%) |
346.50 |
331.00 - 379.30 |
3.1855 times |
Fri 22 August 2025 |
344.85 (7.08%) |
328.00 |
324.90 - 352.85 |
3.1586 times |

Monthly price and charts GngElectronics Strong monthly Stock price targets for GngElectronics EBGNG are 285.93 and 341.58 | Monthly Target 1 | 273.07 | | Monthly Target 2 | 298.78 | | Monthly Target 3 | 328.71666666667 | | Monthly Target 4 | 354.43 | | Monthly Target 5 | 384.37 |
Monthly price and volumes Gng Electronics
| Date |
Closing |
Open |
Range |
Volume |
Tue 28 October 2025 |
324.50 (-6.74%) |
347.00 |
303.00 - 358.65 |
0.2053 times |
Tue 30 September 2025 |
347.95 (1.8%) |
345.80 |
335.00 - 401.70 |
0.6504 times |
Fri 29 August 2025 |
341.80 (3.23%) |
331.00 |
300.00 - 379.30 |
1.5824 times |
Thu 31 July 2025 |
331.09 (0%) |
355.00 |
321.20 - 359.40 |
1.5619 times |
Wed 29 October 2025 |
(0%) |
|
- |
0 times |

DMA SMA EMA moving averages of Gng Electronics EBGNG
DMA (daily moving average) of Gng Electronics EBGNG
| DMA period | DMA value | | 5 day DMA | 325.72 | | 12 day DMA | 325.36 | | 20 day DMA | 332.89 | | 35 day DMA | 345.71 | | 50 day DMA | 346.08 | | 100 day DMA | | | 150 day DMA | | | 200 day DMA | | EMA (exponential moving average) of Gng Electronics EBGNG
| EMA period | EMA current | EMA prev | EMA prev2 | | 5 day EMA | 324.57 | 324.61 | 326.39 | | 12 day EMA | 328.11 | 328.77 | 330.17 | | 20 day EMA | 332.69 | 333.55 | 334.87 | | 35 day EMA | 336.54 | 337.25 | 338.2 | | 50 day EMA | 341.89 | 342.6 | 343.48 |
SMA (simple moving average) of Gng Electronics EBGNG
| SMA period | SMA current | SMA prev | SMA prev2 | | 5 day SMA | 325.72 | 325.82 | 326.14 | | 12 day SMA | 325.36 | 326.94 | 328.21 | | 20 day SMA | 332.89 | 333.94 | 335.5 | | 35 day SMA | 345.71 | 346.84 | 347.83 | | 50 day SMA | 346.08 | 346.21 | 346.23 | | 100 day SMA | | 150 day SMA | | 200 day SMA |
|
|
