DivinePower DPEL_ST full analysis,charts,indicators,moving averages,SMA,DMA,EMA,ADX,MACD,RSIDivine Power DPEL_ST WideScreen charts, DMA,SMA,EMA technical analysis, forecast prediction, by indicators ADX,MACD,RSI,CCI NSE stock exchange
Daily price and charts and targets DivinePower Strong Daily Stock price targets for DivinePower DPEL_ST are 269.55 and 274.75 | Daily Target 1 | 265.27 | | Daily Target 2 | 268.63 | | Daily Target 3 | 270.46666666667 | | Daily Target 4 | 273.83 | | Daily Target 5 | 275.67 |
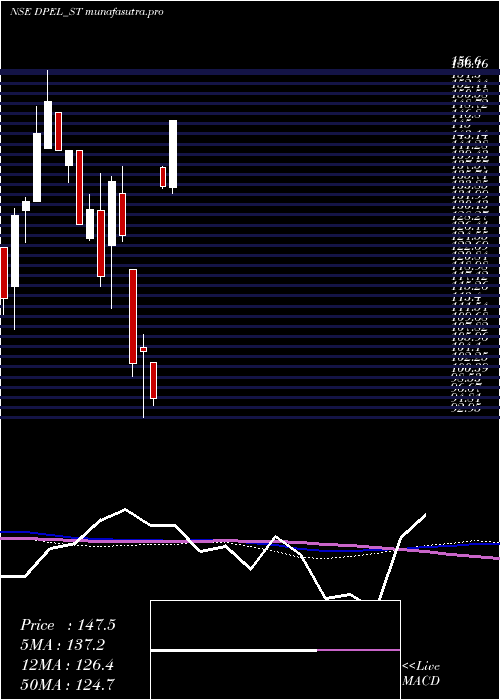
Daily price and volume Divine Power
| Date |
Closing |
Open |
Range |
Volume |
Tue 28 October 2025 |
272.00 (1.87%) |
267.10 |
267.10 - 272.30 |
1.4815 times |
Mon 27 October 2025 |
267.00 (0.75%) |
267.00 |
267.00 - 267.00 |
2.4691 times |
Fri 24 October 2025 |
265.00 (0%) |
267.00 |
265.00 - 267.00 |
0.6173 times |
Thu 23 October 2025 |
265.00 (-0.75%) |
267.00 |
265.00 - 267.00 |
0.7407 times |
Tue 21 October 2025 |
267.00 (0%) |
267.00 |
267.00 - 267.00 |
0.3704 times |
Mon 20 October 2025 |
267.00 (0.19%) |
267.00 |
267.00 - 267.05 |
0.6173 times |
Fri 17 October 2025 |
266.50 (0.57%) |
266.50 |
266.50 - 267.00 |
0.6173 times |
Thu 16 October 2025 |
265.00 (-1.19%) |
269.75 |
265.00 - 269.75 |
0.8642 times |
Wed 15 October 2025 |
268.20 (0.73%) |
267.00 |
267.00 - 268.20 |
0.7407 times |
Tue 14 October 2025 |
266.25 (-1.93%) |
268.25 |
266.10 - 268.25 |
1.4815 times |
Mon 13 October 2025 |
271.50 (-2.76%) |
275.00 |
271.00 - 279.95 |
1.9753 times |

Weekly price and charts DivinePower Strong weekly Stock price targets for DivinePower DPEL_ST are 269.5 and 274.8 | Weekly Target 1 | 265.13 | | Weekly Target 2 | 268.57 | | Weekly Target 3 | 270.43333333333 | | Weekly Target 4 | 273.87 | | Weekly Target 5 | 275.73 |
Weekly price and volumes for Divine Power
| Date |
Closing |
Open |
Range |
Volume |
Tue 28 October 2025 |
272.00 (2.64%) |
267.00 |
267.00 - 272.30 |
0.4444 times |
Fri 24 October 2025 |
265.00 (-0.56%) |
267.00 |
265.00 - 267.05 |
0.2639 times |
Fri 17 October 2025 |
266.50 (-4.55%) |
275.00 |
265.00 - 279.95 |
0.6389 times |
Fri 10 October 2025 |
279.20 (17.68%) |
240.00 |
239.00 - 282.25 |
3.5972 times |
Fri 03 October 2025 |
237.25 (-0.32%) |
238.10 |
236.00 - 244.45 |
0.7778 times |
Fri 26 September 2025 |
238.00 (-0.73%) |
239.75 |
227.80 - 244.90 |
1.8333 times |
Fri 19 September 2025 |
239.75 (84.71%) |
245.00 |
239.60 - 249.00 |
1.3056 times |
Thu 14 August 2025 |
129.80 (-0.38%) |
130.50 |
123.00 - 130.50 |
0.5278 times |
Fri 08 August 2025 |
130.30 (0.62%) |
125.45 |
125.30 - 133.35 |
0.3889 times |
Fri 01 August 2025 |
129.50 (-3%) |
131.00 |
129.50 - 136.00 |
0.2222 times |
Fri 25 July 2025 |
133.50 (-5.99%) |
142.00 |
133.00 - 145.00 |
0.5556 times |
Monthly price and charts DivinePower Strong monthly Stock price targets for DivinePower DPEL_ST are 254.5 and 299.75 | Monthly Target 1 | 218.5 | | Monthly Target 2 | 245.25 | | Monthly Target 3 | 263.75 | | Monthly Target 4 | 290.5 | | Monthly Target 5 | 309 |
Monthly price and volumes Divine Power
| Date |
Closing |
Open |
Range |
Volume |
Tue 28 October 2025 |
272.00 (15.25%) |
238.10 |
237.00 - 282.25 |
1.3359 times |
Tue 30 September 2025 |
236.00 (81.82%) |
245.00 |
227.80 - 249.00 |
0.9129 times |
Thu 14 August 2025 |
129.80 (0.23%) |
133.50 |
123.00 - 133.50 |
0.2573 times |
Thu 31 July 2025 |
129.50 (-6.13%) |
140.70 |
129.50 - 154.45 |
0.564 times |
Mon 30 June 2025 |
137.95 (-7.1%) |
146.00 |
135.10 - 148.85 |
0.5111 times |
Fri 30 May 2025 |
148.50 (53.89%) |
138.90 |
134.00 - 162.55 |
0.6521 times |
Fri 28 February 2025 |
96.50 (-29.15%) |
134.10 |
92.95 - 139.00 |
0.8248 times |
Fri 31 January 2025 |
136.20 (-0.18%) |
136.00 |
113.05 - 141.95 |
1.5051 times |
Tue 31 December 2024 |
136.45 (4.92%) |
131.00 |
125.15 - 156.60 |
3.0173 times |
Fri 29 November 2024 |
130.05 (16.12%) |
120.00 |
120.00 - 131.35 |
0.4195 times |
Mon 15 July 2024 |
112.00 (0%) |
155.00 |
109.10 - 162.75 |
14.7832 times |

DMA SMA EMA moving averages of Divine Power DPEL_ST
DMA (daily moving average) of Divine Power DPEL_ST
| DMA period | DMA value | | 5 day DMA | 267.2 | | 12 day DMA | 268.3 | | 20 day DMA | 259.37 | | 35 day DMA | 225.13 | | 50 day DMA | 198.84 | | 100 day DMA | 167.04 | | 150 day DMA | 156.12 | | 200 day DMA | | EMA (exponential moving average) of Divine Power DPEL_ST
| EMA period | EMA current | EMA prev | EMA prev2 | | 5 day EMA | 268.11 | 266.16 | 265.74 | | 12 day EMA | 263.76 | 262.26 | 261.4 | | 20 day EMA | 253.53 | 251.59 | 249.97 | | 35 day EMA | 228.82 | 226.28 | 223.88 | | 50 day EMA | 201.47 | 198.59 | 195.8 |
SMA (simple moving average) of Divine Power DPEL_ST
| SMA period | SMA current | SMA prev | SMA prev2 | | 5 day SMA | 267.2 | 266.2 | 266.1 | | 12 day SMA | 268.3 | 268.15 | 267.33 | | 20 day SMA | 259.37 | 257.67 | 256.47 | | 35 day SMA | 225.13 | 220.98 | 217.05 | | 50 day SMA | 198.84 | 196.29 | 193.88 | | 100 day SMA | 167.04 | 165.37 | 163.79 | | 150 day SMA | 156.12 | 155.17 | 154.26 | | 200 day SMA |
|
|
