DP DPABHUSHAN full analysis,charts,indicators,moving averages,SMA,DMA,EMA,ADX,MACD,RSID P DPABHUSHAN WideScreen charts, DMA,SMA,EMA technical analysis, forecast prediction, by indicators ADX,MACD,RSI,CCI NSE stock exchange
Daily price and charts and targets DP Strong Daily Stock price targets for DP DPABHUSHAN are 1350.3 and 1371.2 | Daily Target 1 | 1346.23 | | Daily Target 2 | 1354.37 | | Daily Target 3 | 1367.1333333333 | | Daily Target 4 | 1375.27 | | Daily Target 5 | 1388.03 |
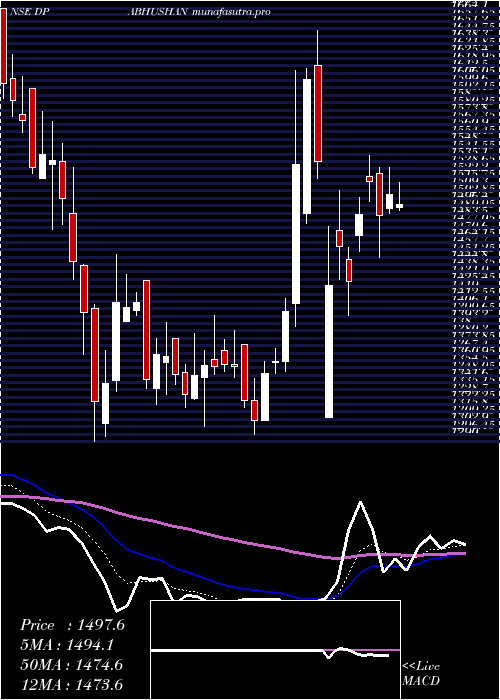
Daily price and volume D P
| Date |
Closing |
Open |
Range |
Volume |
Tue 28 October 2025 |
1362.50 (-0.72%) |
1379.90 |
1359.00 - 1379.90 |
0.5612 times |
Mon 27 October 2025 |
1372.40 (-0.93%) |
1370.50 |
1365.30 - 1389.80 |
0.8226 times |
Fri 24 October 2025 |
1385.30 (-0.06%) |
1397.80 |
1375.00 - 1397.80 |
0.4739 times |
Thu 23 October 2025 |
1386.20 (-1.88%) |
1416.00 |
1380.00 - 1420.00 |
0.845 times |
Tue 21 October 2025 |
1412.70 (1.22%) |
1414.90 |
1400.10 - 1417.40 |
0.2306 times |
Mon 20 October 2025 |
1395.70 (0.41%) |
1376.00 |
1374.80 - 1399.30 |
0.5355 times |
Fri 17 October 2025 |
1390.00 (-2%) |
1406.00 |
1380.10 - 1411.20 |
0.4474 times |
Thu 16 October 2025 |
1418.30 (2.68%) |
1398.50 |
1381.00 - 1431.90 |
1.3449 times |
Wed 15 October 2025 |
1381.30 (0.13%) |
1397.90 |
1348.00 - 1397.90 |
2.1307 times |
Tue 14 October 2025 |
1379.50 (-2.93%) |
1428.00 |
1375.10 - 1434.40 |
2.6081 times |
Mon 13 October 2025 |
1421.20 (-0.41%) |
1426.60 |
1410.00 - 1431.60 |
0.5762 times |
Weekly price and charts DP Strong weekly Stock price targets for DP DPABHUSHAN are 1345.35 and 1376.15 | Weekly Target 1 | 1339.63 | | Weekly Target 2 | 1351.07 | | Weekly Target 3 | 1370.4333333333 | | Weekly Target 4 | 1381.87 | | Weekly Target 5 | 1401.23 |
Weekly price and volumes for D P
| Date |
Closing |
Open |
Range |
Volume |
Tue 28 October 2025 |
1362.50 (-1.65%) |
1370.50 |
1359.00 - 1389.80 |
0.1124 times |
Fri 24 October 2025 |
1385.30 (-0.34%) |
1376.00 |
1374.80 - 1420.00 |
0.1693 times |
Fri 17 October 2025 |
1390.00 (-2.59%) |
1426.60 |
1348.00 - 1434.40 |
0.5773 times |
Fri 10 October 2025 |
1427.00 (-1.14%) |
1457.90 |
1410.00 - 1479.00 |
1.481 times |
Fri 03 October 2025 |
1443.40 (-2.22%) |
1450.00 |
1418.80 - 1479.90 |
0.8007 times |
Fri 26 September 2025 |
1476.20 (-6.28%) |
1581.50 |
1461.30 - 1581.50 |
1.0927 times |
Fri 19 September 2025 |
1575.20 (1.74%) |
1554.50 |
1541.80 - 1600.00 |
1.2283 times |
Fri 12 September 2025 |
1548.30 (-1.86%) |
1580.00 |
1531.00 - 1599.90 |
1.3517 times |
Fri 05 September 2025 |
1577.70 (0.43%) |
1570.90 |
1549.20 - 1617.00 |
1.739 times |
Fri 29 August 2025 |
1570.90 (-1.67%) |
1588.90 |
1545.20 - 1627.10 |
1.4476 times |
Fri 22 August 2025 |
1597.50 (-1.39%) |
1630.00 |
1577.30 - 1719.90 |
2.4658 times |

Monthly price and charts DP Strong monthly Stock price targets for DP DPABHUSHAN are 1289.75 and 1420.75 | Monthly Target 1 | 1265.5 | | Monthly Target 2 | 1314 | | Monthly Target 3 | 1396.5 | | Monthly Target 4 | 1445 | | Monthly Target 5 | 1527.5 |
Monthly price and volumes D P
| Date |
Closing |
Open |
Range |
Volume |
Tue 28 October 2025 |
1362.50 (-4.64%) |
1435.00 |
1348.00 - 1479.00 |
0.5873 times |
Tue 30 September 2025 |
1428.80 (-9.05%) |
1570.90 |
1421.00 - 1617.00 |
1.2758 times |
Fri 29 August 2025 |
1570.90 (-5.48%) |
1669.90 |
1545.20 - 1719.90 |
1.728 times |
Thu 31 July 2025 |
1662.00 (16.32%) |
1424.50 |
1410.10 - 1729.60 |
2.2942 times |
Mon 30 June 2025 |
1428.80 (-5.98%) |
1530.00 |
1390.00 - 1557.60 |
0.3316 times |
Fri 30 May 2025 |
1519.60 (7.11%) |
1422.00 |
1301.00 - 1610.00 |
0.5306 times |
Wed 30 April 2025 |
1418.70 (4.31%) |
1360.00 |
1311.10 - 1649.90 |
0.6775 times |
Fri 28 March 2025 |
1360.10 (-3.04%) |
1406.20 |
1290.00 - 1453.80 |
0.5326 times |
Fri 28 February 2025 |
1402.70 (-13.65%) |
1625.00 |
1365.80 - 1895.00 |
1.0978 times |
Fri 31 January 2025 |
1624.40 (8.41%) |
1487.00 |
1345.00 - 1739.95 |
0.9445 times |
Tue 31 December 2024 |
1498.35 (-0.46%) |
1500.10 |
1476.00 - 1703.05 |
0.9372 times |

DMA SMA EMA moving averages of D P DPABHUSHAN
DMA (daily moving average) of D P DPABHUSHAN
| DMA period | DMA value | | 5 day DMA | 1383.82 | | 12 day DMA | 1394.34 | | 20 day DMA | 1408.98 | | 35 day DMA | 1468.21 | | 50 day DMA | 1509.29 | | 100 day DMA | 1525.2 | | 150 day DMA | 1501.25 | | 200 day DMA | 1511.95 | EMA (exponential moving average) of D P DPABHUSHAN
| EMA period | EMA current | EMA prev | EMA prev2 | | 5 day EMA | 1378.59 | 1386.63 | 1393.75 | | 12 day EMA | 1396.41 | 1402.57 | 1408.05 | | 20 day EMA | 1418.81 | 1424.74 | 1430.25 | | 35 day EMA | 1460.32 | 1466.08 | 1471.59 | | 50 day EMA | 1506.89 | 1512.78 | 1518.51 |
SMA (simple moving average) of D P DPABHUSHAN
| SMA period | SMA current | SMA prev | SMA prev2 | | 5 day SMA | 1383.82 | 1390.46 | 1393.98 | | 12 day SMA | 1394.34 | 1399.37 | 1404.22 | | 20 day SMA | 1408.98 | 1414.66 | 1420.97 | | 35 day SMA | 1468.21 | 1474.36 | 1479.84 | | 50 day SMA | 1509.29 | 1514.38 | 1519.73 | | 100 day SMA | 1525.2 | 1526.53 | 1527.7 | | 150 day SMA | 1501.25 | 1501.21 | 1501.05 | | 200 day SMA | 1511.95 | 1512.03 | 1512.25 |
|
|
