DolphinfEnt DOLPHIN full analysis,charts,indicators,moving averages,SMA,DMA,EMA,ADX,MACD,RSIDolphinf Ent DOLPHIN WideScreen charts, DMA,SMA,EMA technical analysis, forecast prediction, by indicators ADX,MACD,RSI,CCI NSE stock exchange
Daily price and charts and targets DolphinfEnt Strong Daily Stock price targets for DolphinfEnt DOLPHIN are 361.18 and 375.18 | Daily Target 1 | 358.12 | | Daily Target 2 | 364.23 | | Daily Target 3 | 372.11666666667 | | Daily Target 4 | 378.23 | | Daily Target 5 | 386.12 |
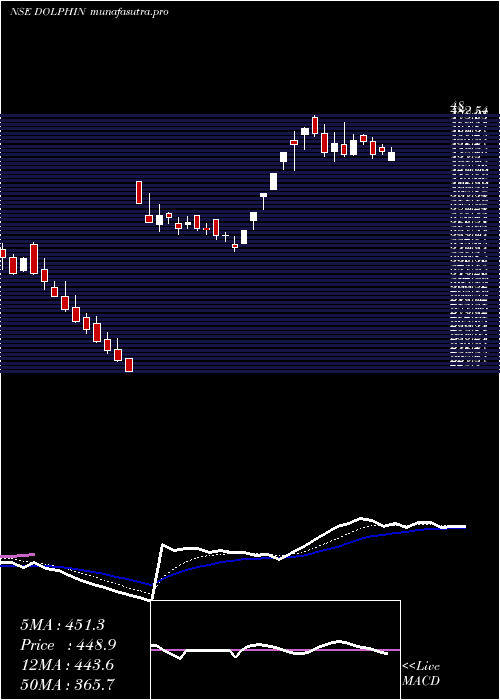
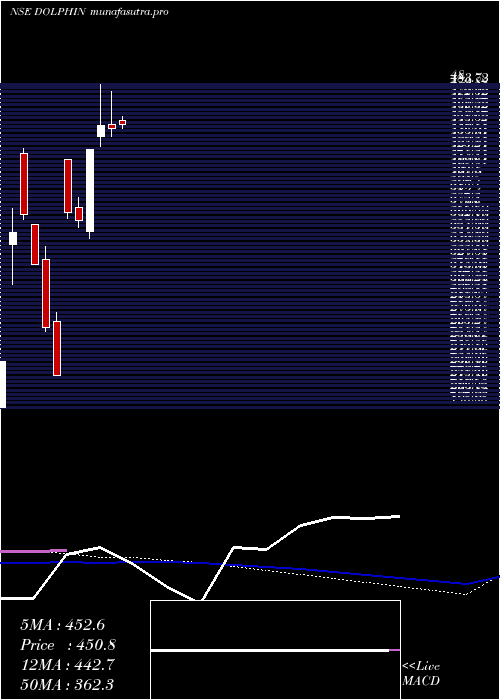
Daily price and volume Dolphinf Ent
| Date |
Closing |
Open |
Range |
Volume |
Wed 29 October 2025 |
370.35 (-1.84%) |
377.00 |
366.00 - 380.00 |
2.0045 times |
Tue 28 October 2025 |
377.30 (0.01%) |
383.90 |
376.05 - 384.10 |
0.5184 times |
Mon 27 October 2025 |
377.25 (0.86%) |
386.90 |
376.30 - 386.90 |
0.8439 times |
Fri 24 October 2025 |
374.05 (-0.82%) |
373.00 |
373.00 - 387.95 |
1.1605 times |
Thu 23 October 2025 |
377.15 (-2.2%) |
385.65 |
372.00 - 395.00 |
0.9041 times |
Tue 21 October 2025 |
385.65 (2.05%) |
383.00 |
372.00 - 395.00 |
0.631 times |
Mon 20 October 2025 |
377.90 (-1.19%) |
377.00 |
375.00 - 383.00 |
1.1093 times |
Fri 17 October 2025 |
382.45 (0.84%) |
387.00 |
376.70 - 387.05 |
0.7893 times |
Thu 16 October 2025 |
379.25 (-0.71%) |
382.00 |
375.20 - 388.90 |
0.6466 times |
Wed 15 October 2025 |
381.95 (0.75%) |
372.10 |
372.10 - 389.65 |
1.3924 times |
Tue 14 October 2025 |
379.10 (1.07%) |
375.10 |
375.10 - 412.00 |
6.8395 times |
Weekly price and charts DolphinfEnt Strong weekly Stock price targets for DolphinfEnt DOLPHIN are 357.73 and 378.63 | Weekly Target 1 | 353.52 | | Weekly Target 2 | 361.93 | | Weekly Target 3 | 374.41666666667 | | Weekly Target 4 | 382.83 | | Weekly Target 5 | 395.32 |
Weekly price and volumes for Dolphinf Ent
| Date |
Closing |
Open |
Range |
Volume |
Wed 29 October 2025 |
370.35 (-0.99%) |
386.90 |
366.00 - 386.90 |
0.3004 times |
Fri 24 October 2025 |
374.05 (-2.2%) |
377.00 |
372.00 - 395.00 |
0.3395 times |
Fri 17 October 2025 |
382.45 (-0.13%) |
382.00 |
371.20 - 412.00 |
0.9073 times |
Fri 10 October 2025 |
382.95 (-2.85%) |
395.95 |
375.95 - 396.00 |
0.409 times |
Fri 03 October 2025 |
394.20 (4.83%) |
382.95 |
379.55 - 403.90 |
0.5578 times |
Fri 26 September 2025 |
376.05 (-6.68%) |
402.95 |
365.00 - 415.95 |
1.2261 times |
Fri 19 September 2025 |
402.95 (0.36%) |
401.50 |
391.05 - 422.45 |
1.4275 times |
Fri 12 September 2025 |
401.50 (-4.95%) |
424.50 |
391.20 - 428.90 |
1.8292 times |
Fri 05 September 2025 |
422.40 (-1.31%) |
446.90 |
417.50 - 446.90 |
1.2941 times |
Fri 29 August 2025 |
428.00 (-2.72%) |
446.00 |
424.65 - 454.00 |
1.7092 times |
Fri 22 August 2025 |
439.95 (-0.03%) |
444.90 |
400.00 - 449.40 |
2.6429 times |
Monthly price and charts DolphinfEnt Strong monthly Stock price targets for DolphinfEnt DOLPHIN are 345.18 and 391.18 | Monthly Target 1 | 336.78 | | Monthly Target 2 | 353.57 | | Monthly Target 3 | 382.78333333333 | | Monthly Target 4 | 399.57 | | Monthly Target 5 | 428.78 |
Monthly price and volumes Dolphinf Ent
| Date |
Closing |
Open |
Range |
Volume |
Wed 29 October 2025 |
370.35 (-4.98%) |
403.90 |
366.00 - 412.00 |
0.181 times |
Tue 30 September 2025 |
389.75 (-8.94%) |
446.90 |
365.00 - 446.90 |
0.5011 times |
Fri 29 August 2025 |
428.00 (-1.95%) |
434.60 |
385.50 - 454.00 |
0.8163 times |
Thu 31 July 2025 |
436.50 (-2.73%) |
462.00 |
413.95 - 486.95 |
1.7339 times |
Mon 30 June 2025 |
448.75 (100.87%) |
419.00 |
347.35 - 448.75 |
1.3411 times |
Thu 20 February 2025 |
223.40 (-39.46%) |
359.90 |
223.40 - 359.90 |
3.0259 times |
Fri 31 January 2025 |
369.00 (4.56%) |
424.00 |
364.95 - 429.00 |
0.4264 times |
Thu 18 April 2024 |
352.90 (49.53%) |
342.20 |
305.50 - 374.70 |
0.9711 times |
Wed 06 September 2023 |
236.00 (0%) |
195.05 |
195.05 - 236.00 |
0.0031 times |
Wed 29 October 2025 |
(0%) |
|
- |
0 times |

DMA SMA EMA moving averages of Dolphinf Ent DOLPHIN
DMA (daily moving average) of Dolphinf Ent DOLPHIN
| DMA period | DMA value | | 5 day DMA | 375.22 | | 12 day DMA | 378.13 | | 20 day DMA | 382.06 | | 35 day DMA | 388.56 | | 50 day DMA | 400.23 | | 100 day DMA | 408.41 | | 150 day DMA | | | 200 day DMA | | EMA (exponential moving average) of Dolphinf Ent DOLPHIN
| EMA period | EMA current | EMA prev | EMA prev2 | | 5 day EMA | 375.26 | 377.71 | 377.92 | | 12 day EMA | 378.58 | 380.07 | 380.57 | | 20 day EMA | 382.3 | 383.56 | 384.22 | | 35 day EMA | 390.7 | 391.9 | 392.76 | | 50 day EMA | 398.91 | 400.08 | 401.01 |
SMA (simple moving average) of Dolphinf Ent DOLPHIN
| SMA period | SMA current | SMA prev | SMA prev2 | | 5 day SMA | 375.22 | 378.28 | 378.4 | | 12 day SMA | 378.13 | 379.18 | 379.63 | | 20 day SMA | 382.06 | 383.09 | 383.03 | | 35 day SMA | 388.56 | 389.43 | 390.72 | | 50 day SMA | 400.23 | 401.62 | 402.76 | | 100 day SMA | 408.41 | 407.06 | 405.74 | | 150 day SMA | | 200 day SMA |
|
|
