DLink DLINKINDIA full analysis,charts,indicators,moving averages,SMA,DMA,EMA,ADX,MACD,RSID Link DLINKINDIA WideScreen charts, DMA,SMA,EMA technical analysis, forecast prediction, by indicators ADX,MACD,RSI,CCI NSE stock exchange
operates under IT Networking Equipment sector
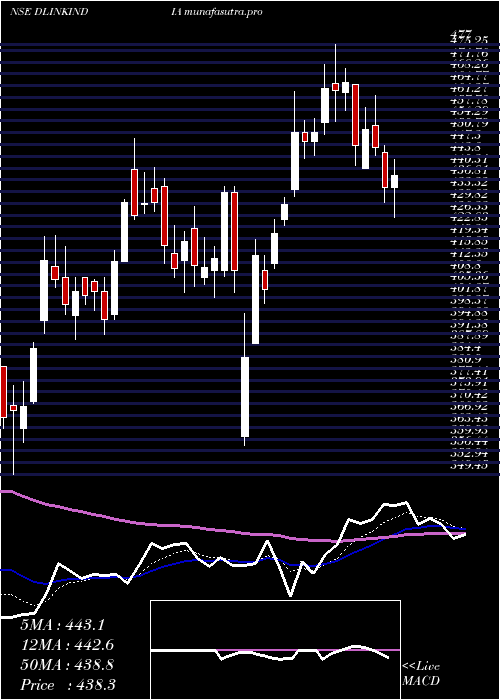
Daily price and charts and targets DLink Strong Daily Stock price targets for DLink DLINKINDIA are 451.58 and 459.23 | Daily Target 1 | 446.13 | | Daily Target 2 | 449.37 | | Daily Target 3 | 453.78333333333 | | Daily Target 4 | 457.02 | | Daily Target 5 | 461.43 |
Daily price and volume D Link
| Date |
Closing |
Open |
Range |
Volume |
Tue 28 October 2025 |
452.60 (-0.55%) |
450.55 |
450.55 - 458.20 |
0.665 times |
Mon 27 October 2025 |
455.10 (-0.14%) |
455.75 |
453.55 - 461.70 |
1.2028 times |
Fri 24 October 2025 |
455.75 (-1.05%) |
461.50 |
454.10 - 462.60 |
0.8288 times |
Thu 23 October 2025 |
460.60 (0.25%) |
460.00 |
458.05 - 465.90 |
1.153 times |
Tue 21 October 2025 |
459.45 (1.06%) |
459.50 |
456.30 - 464.00 |
0.4484 times |
Mon 20 October 2025 |
454.65 (-2.16%) |
464.70 |
452.80 - 467.20 |
2.0278 times |
Fri 17 October 2025 |
464.70 (-1.12%) |
474.00 |
462.00 - 477.70 |
1.2387 times |
Thu 16 October 2025 |
469.95 (-0.35%) |
469.70 |
467.10 - 473.95 |
0.888 times |
Wed 15 October 2025 |
471.60 (0.73%) |
469.50 |
468.15 - 473.00 |
0.5936 times |
Tue 14 October 2025 |
468.20 (-1.07%) |
473.25 |
465.65 - 476.00 |
0.954 times |
Mon 13 October 2025 |
473.25 (-0.31%) |
471.30 |
469.90 - 475.50 |
0.7349 times |
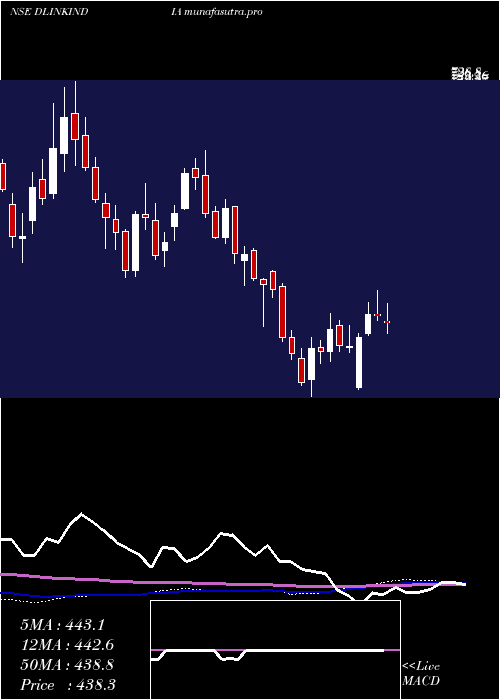
Weekly price and charts DLink Strong weekly Stock price targets for DLink DLINKINDIA are 446 and 457.15 | Weekly Target 1 | 443.8 | | Weekly Target 2 | 448.2 | | Weekly Target 3 | 454.95 | | Weekly Target 4 | 459.35 | | Weekly Target 5 | 466.1 |
Weekly price and volumes for D Link
| Date |
Closing |
Open |
Range |
Volume |
Tue 28 October 2025 |
452.60 (-0.69%) |
455.75 |
450.55 - 461.70 |
0.279 times |
Fri 24 October 2025 |
455.75 (-1.93%) |
464.70 |
452.80 - 467.20 |
0.6658 times |
Fri 17 October 2025 |
464.70 (-2.11%) |
471.30 |
462.00 - 477.70 |
0.6585 times |
Fri 10 October 2025 |
474.70 (-2.61%) |
489.95 |
468.10 - 490.35 |
0.9039 times |
Fri 03 October 2025 |
487.40 (3.14%) |
475.40 |
463.80 - 504.00 |
1.7862 times |
Fri 26 September 2025 |
472.55 (-6.07%) |
504.10 |
467.50 - 504.95 |
0.6701 times |
Fri 19 September 2025 |
503.10 (3.99%) |
489.00 |
479.20 - 518.00 |
2.1786 times |
Fri 12 September 2025 |
483.80 (1.52%) |
493.95 |
482.00 - 498.80 |
0.961 times |
Fri 05 September 2025 |
476.55 (0.76%) |
477.35 |
470.80 - 496.70 |
1.026 times |
Fri 29 August 2025 |
472.95 (-2.4%) |
486.90 |
457.20 - 487.95 |
0.8709 times |
Fri 22 August 2025 |
484.60 (-1.35%) |
502.00 |
483.05 - 507.40 |
0.8302 times |
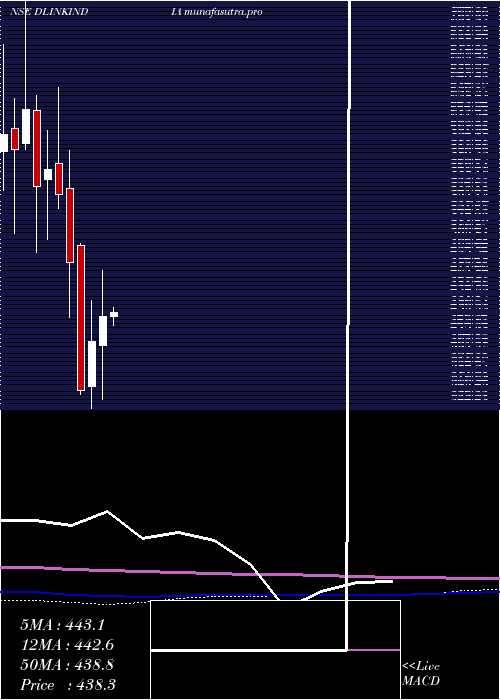
Monthly price and charts DLink Strong monthly Stock price targets for DLink DLINKINDIA are 424.85 and 478.3 | Monthly Target 1 | 415.6 | | Monthly Target 2 | 434.1 | | Monthly Target 3 | 469.05 | | Monthly Target 4 | 487.55 | | Monthly Target 5 | 522.5 |
Monthly price and volumes D Link
| Date |
Closing |
Open |
Range |
Volume |
Tue 28 October 2025 |
452.60 (-3.51%) |
469.15 |
450.55 - 504.00 |
0.4831 times |
Tue 30 September 2025 |
469.05 (-0.82%) |
477.35 |
463.80 - 518.00 |
0.6297 times |
Fri 29 August 2025 |
472.95 (-7.81%) |
509.10 |
457.20 - 525.00 |
0.5194 times |
Thu 31 July 2025 |
513.00 (-8.78%) |
574.40 |
480.75 - 589.55 |
1.6789 times |
Mon 30 June 2025 |
562.35 (16.45%) |
483.75 |
473.85 - 572.45 |
2.283 times |
Fri 30 May 2025 |
482.90 (11.16%) |
434.40 |
425.80 - 515.90 |
1.2218 times |
Wed 30 April 2025 |
434.40 (5.59%) |
408.00 |
358.15 - 477.00 |
0.7887 times |
Fri 28 March 2025 |
411.40 (12.28%) |
370.05 |
349.45 - 449.00 |
0.821 times |
Fri 28 February 2025 |
366.40 (-24.33%) |
500.05 |
363.00 - 501.20 |
0.7266 times |
Fri 31 January 2025 |
484.20 (-11.42%) |
552.05 |
433.85 - 586.60 |
0.8478 times |
Tue 31 December 2024 |
546.60 (-3.95%) |
575.10 |
534.00 - 645.10 |
1.7952 times |
DMA SMA EMA moving averages of D Link DLINKINDIA
DMA (daily moving average) of D Link DLINKINDIA
| DMA period | DMA value | | 5 day DMA | 456.7 | | 12 day DMA | 463.38 | | 20 day DMA | 468.98 | | 35 day DMA | 478.77 | | 50 day DMA | 480.08 | | 100 day DMA | 505.83 | | 150 day DMA | 489.44 | | 200 day DMA | 480.06 | EMA (exponential moving average) of D Link DLINKINDIA
| EMA period | EMA current | EMA prev | EMA prev2 | | 5 day EMA | 456.42 | 458.33 | 459.94 | | 12 day EMA | 462.37 | 464.15 | 465.79 | | 20 day EMA | 467.62 | 469.2 | 470.68 | | 35 day EMA | 473.78 | 475.03 | 476.2 | | 50 day EMA | 479.8 | 480.91 | 481.96 |
SMA (simple moving average) of D Link DLINKINDIA
| SMA period | SMA current | SMA prev | SMA prev2 | | 5 day SMA | 456.7 | 457.11 | 459.03 | | 12 day SMA | 463.38 | 464.93 | 466.69 | | 20 day SMA | 468.98 | 469.98 | 471.28 | | 35 day SMA | 478.77 | 479.45 | 480.07 | | 50 day SMA | 480.08 | 481.15 | 482.08 | | 100 day SMA | 505.83 | 506.09 | 506.32 | | 150 day SMA | 489.44 | 489.29 | 489.01 | | 200 day SMA | 480.06 | 480.5 | 481.1 |
|
|
