DhruvConsultancy DHRUV full analysis,charts,indicators,moving averages,SMA,DMA,EMA,ADX,MACD,RSIDhruv Consultancy DHRUV WideScreen charts, DMA,SMA,EMA technical analysis, forecast prediction, by indicators ADX,MACD,RSI,CCI NSE stock exchange
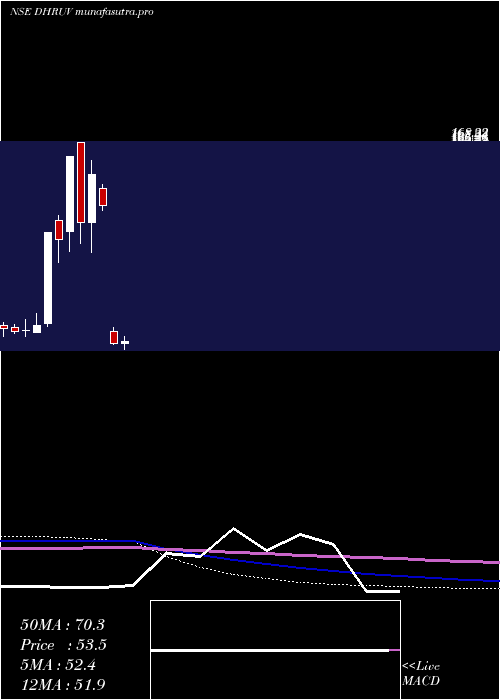
Daily price and charts and targets DhruvConsultancy Strong Daily Stock price targets for DhruvConsultancy DHRUV are 51.58 and 54.83 | Daily Target 1 | 50.93 | | Daily Target 2 | 52.22 | | Daily Target 3 | 54.183333333333 | | Daily Target 4 | 55.47 | | Daily Target 5 | 57.43 |
Daily price and volume Dhruv Consultancy
| Date |
Closing |
Open |
Range |
Volume |
Wed 29 October 2025 |
53.50 (-0.07%) |
54.00 |
52.90 - 56.15 |
1.6394 times |
Tue 28 October 2025 |
53.54 (4.51%) |
50.70 |
50.70 - 54.60 |
1.3499 times |
Mon 27 October 2025 |
51.23 (-0.25%) |
51.99 |
50.51 - 52.40 |
1.0988 times |
Fri 24 October 2025 |
51.36 (0.65%) |
51.80 |
50.50 - 51.90 |
0.4976 times |
Thu 23 October 2025 |
51.03 (1.98%) |
51.90 |
48.90 - 51.90 |
0.7414 times |
Tue 21 October 2025 |
50.04 (1.58%) |
51.25 |
49.50 - 51.25 |
0.4157 times |
Mon 20 October 2025 |
49.26 (-1.3%) |
50.15 |
49.10 - 51.90 |
0.3142 times |
Fri 17 October 2025 |
49.91 (-0.4%) |
51.69 |
49.00 - 51.70 |
1.4322 times |
Thu 16 October 2025 |
50.11 (-0.81%) |
50.52 |
50.10 - 51.65 |
0.7093 times |
Wed 15 October 2025 |
50.52 (-0.59%) |
52.50 |
50.20 - 52.50 |
1.8015 times |
Tue 14 October 2025 |
50.82 (-1.51%) |
52.40 |
50.05 - 52.40 |
0.8956 times |
Weekly price and charts DhruvConsultancy Strong weekly Stock price targets for DhruvConsultancy DHRUV are 52.01 and 57.65 | Weekly Target 1 | 47.75 | | Weekly Target 2 | 50.62 | | Weekly Target 3 | 53.386666666667 | | Weekly Target 4 | 56.26 | | Weekly Target 5 | 59.03 |
Weekly price and volumes for Dhruv Consultancy
| Date |
Closing |
Open |
Range |
Volume |
Wed 29 October 2025 |
53.50 (4.17%) |
51.99 |
50.51 - 56.15 |
0.2217 times |
Fri 24 October 2025 |
51.36 (2.91%) |
50.15 |
48.90 - 51.90 |
0.1067 times |
Fri 17 October 2025 |
49.91 (-2.16%) |
51.10 |
49.00 - 52.50 |
0.2964 times |
Fri 10 October 2025 |
51.01 (-2.41%) |
52.90 |
50.50 - 53.20 |
0.3504 times |
Fri 03 October 2025 |
52.27 (-2.15%) |
53.42 |
50.67 - 53.60 |
0.1888 times |
Fri 26 September 2025 |
53.42 (-5%) |
57.80 |
53.16 - 59.00 |
0.6186 times |
Fri 19 September 2025 |
56.23 (-0.85%) |
57.00 |
54.78 - 59.67 |
1.1063 times |
Fri 12 September 2025 |
56.71 (-56.96%) |
58.92 |
56.00 - 61.24 |
0.5838 times |
Wed 05 February 2025 |
131.75 (-12.26%) |
142.00 |
129.38 - 144.01 |
1.0015 times |
Fri 31 January 2025 |
150.16 (4.75%) |
150.51 |
135.92 - 158.03 |
5.5258 times |
Fri 24 January 2025 |
143.35 (27.6%) |
114.60 |
109.50 - 143.35 |
0.6872 times |
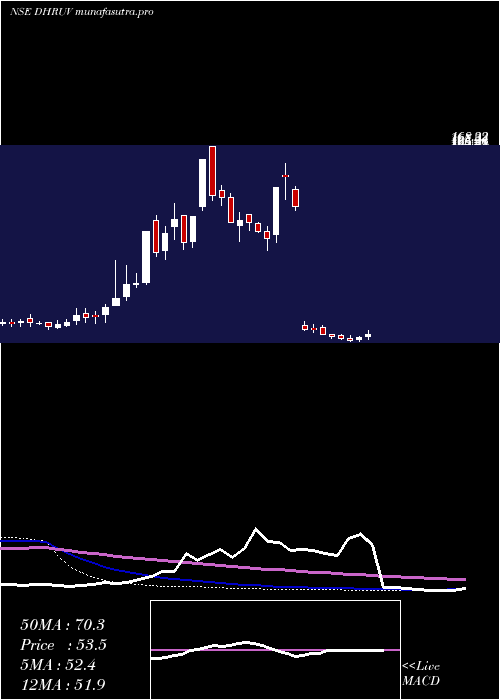
Monthly price and charts DhruvConsultancy Strong monthly Stock price targets for DhruvConsultancy DHRUV are 51.2 and 58.45 | Monthly Target 1 | 45.6 | | Monthly Target 2 | 49.55 | | Monthly Target 3 | 52.85 | | Monthly Target 4 | 56.8 | | Monthly Target 5 | 60.1 |
Monthly price and volumes Dhruv Consultancy
| Date |
Closing |
Open |
Range |
Volume |
Wed 29 October 2025 |
53.50 (2.35%) |
52.01 |
48.90 - 56.15 |
0.1186 times |
Tue 30 September 2025 |
52.27 (-60.33%) |
58.92 |
51.40 - 61.24 |
0.2569 times |
Wed 05 February 2025 |
131.75 (-12.26%) |
142.00 |
129.38 - 144.01 |
0.1083 times |
Fri 31 January 2025 |
150.16 (23.08%) |
122.00 |
105.01 - 158.03 |
0.7787 times |
Tue 31 December 2024 |
122.00 (-23.9%) |
168.33 |
110.26 - 168.33 |
0.7987 times |
Fri 29 November 2024 |
160.32 (42.84%) |
116.95 |
105.21 - 160.32 |
0.7554 times |
Thu 31 October 2024 |
112.24 (-3.78%) |
123.30 |
99.10 - 126.47 |
0.1435 times |
Thu 29 February 2024 |
116.65 (86.94%) |
64.00 |
62.30 - 116.65 |
5.389 times |
Wed 31 January 2024 |
62.40 (4.61%) |
58.75 |
58.35 - 69.30 |
1.0798 times |
Fri 29 December 2023 |
59.65 (0.34%) |
59.60 |
56.25 - 65.90 |
0.5711 times |
Thu 30 November 2023 |
59.45 (-2.14%) |
61.35 |
58.10 - 63.40 |
0.369 times |
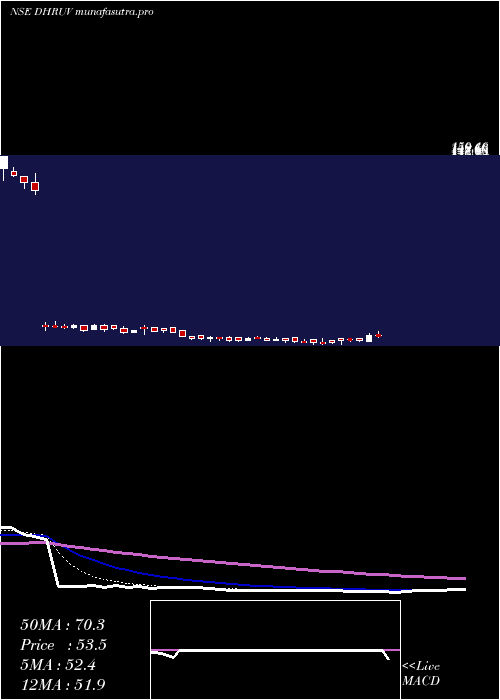
DMA SMA EMA moving averages of Dhruv Consultancy DHRUV
DMA (daily moving average) of Dhruv Consultancy DHRUV
| DMA period | DMA value | | 5 day DMA | 52.13 | | 12 day DMA | 51.08 | | 20 day DMA | 51.38 | | 35 day DMA | 53.61 | | 50 day DMA | 76.87 | | 100 day DMA | 101.64 | | 150 day DMA | 95.7 | | 200 day DMA | 86.73 | EMA (exponential moving average) of Dhruv Consultancy DHRUV
| EMA period | EMA current | EMA prev | EMA prev2 | | 5 day EMA | 52.35 | 51.77 | 50.88 | | 12 day EMA | 51.93 | 51.65 | 51.31 | | 20 day EMA | 54.18 | 54.25 | 54.32 | | 35 day EMA | 65.71 | 66.43 | 67.19 | | 50 day EMA | 77.26 | 78.23 | 79.24 |
SMA (simple moving average) of Dhruv Consultancy DHRUV
| SMA period | SMA current | SMA prev | SMA prev2 | | 5 day SMA | 52.13 | 51.44 | 50.58 | | 12 day SMA | 51.08 | 50.87 | 50.75 | | 20 day SMA | 51.38 | 51.33 | 51.32 | | 35 day SMA | 53.61 | 53.75 | 55.98 | | 50 day SMA | 76.87 | 78.07 | 79.17 | | 100 day SMA | 101.64 | 102.26 | 102.88 | | 150 day SMA | 95.7 | 95.75 | 95.8 | | 200 day SMA | 86.73 | 86.77 | 86.82 |
|
|
