DevyaniInternational DEVYANI full analysis,charts,indicators,moving averages,SMA,DMA,EMA,ADX,MACD,RSIDevyani International DEVYANI WideScreen charts, DMA,SMA,EMA technical analysis, forecast prediction, by indicators ADX,MACD,RSI,CCI NSE stock exchange
Daily price and charts and targets DevyaniInternational Strong Daily Stock price targets for DevyaniInternational DEVYANI are 165.18 and 168.53 | Daily Target 1 | 164.31 | | Daily Target 2 | 166.05 | | Daily Target 3 | 167.65666666667 | | Daily Target 4 | 169.4 | | Daily Target 5 | 171.01 |
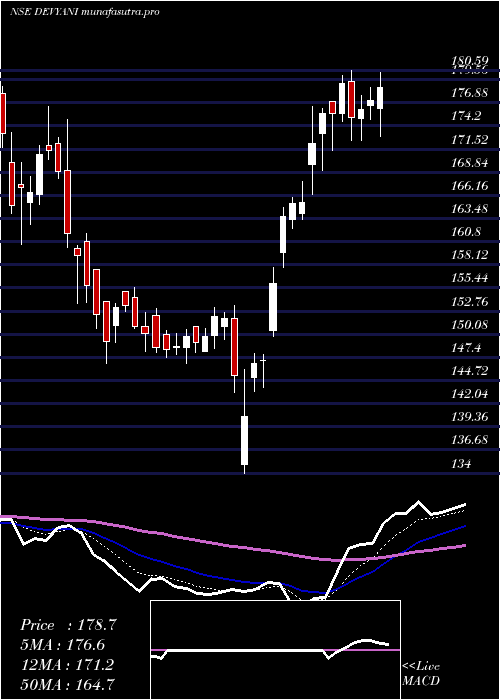
Daily price and volume Devyani International
| Date |
Closing |
Open |
Range |
Volume |
Thu 30 October 2025 |
167.80 (0.05%) |
168.01 |
165.91 - 169.26 |
1.4432 times |
Wed 29 October 2025 |
167.72 (2.29%) |
165.15 |
163.60 - 168.74 |
1.6028 times |
Tue 28 October 2025 |
163.96 (0.61%) |
163.20 |
163.20 - 169.40 |
2.0175 times |
Mon 27 October 2025 |
162.96 (0.26%) |
163.50 |
162.35 - 164.90 |
0.5016 times |
Fri 24 October 2025 |
162.54 (-2.38%) |
166.60 |
162.05 - 166.60 |
1.2774 times |
Thu 23 October 2025 |
166.51 (-0.54%) |
167.40 |
165.68 - 167.87 |
0.401 times |
Tue 21 October 2025 |
167.41 (1.11%) |
165.68 |
165.52 - 168.51 |
0.1043 times |
Mon 20 October 2025 |
165.58 (-1.19%) |
167.58 |
164.75 - 169.75 |
0.5562 times |
Fri 17 October 2025 |
167.58 (-0.1%) |
168.00 |
165.52 - 169.50 |
0.4142 times |
Thu 16 October 2025 |
167.74 (1.9%) |
164.50 |
162.94 - 168.25 |
1.6817 times |
Wed 15 October 2025 |
164.61 (2.78%) |
160.99 |
160.50 - 165.50 |
1.2095 times |
Weekly price and charts DevyaniInternational Strong weekly Stock price targets for DevyaniInternational DEVYANI are 165.08 and 172.13 | Weekly Target 1 | 159.47 | | Weekly Target 2 | 163.63 | | Weekly Target 3 | 166.51666666667 | | Weekly Target 4 | 170.68 | | Weekly Target 5 | 173.57 |
Weekly price and volumes for Devyani International
| Date |
Closing |
Open |
Range |
Volume |
Thu 30 October 2025 |
167.80 (3.24%) |
163.50 |
162.35 - 169.40 |
0.9184 times |
Fri 24 October 2025 |
162.54 (-3.01%) |
167.58 |
162.05 - 169.75 |
0.386 times |
Fri 17 October 2025 |
167.58 (2.51%) |
163.53 |
159.95 - 169.50 |
0.7786 times |
Fri 10 October 2025 |
163.48 (-2.31%) |
167.73 |
161.22 - 168.29 |
0.6278 times |
Fri 03 October 2025 |
167.35 (-1.51%) |
170.25 |
166.00 - 172.74 |
0.7676 times |
Fri 26 September 2025 |
169.91 (-4.89%) |
179.72 |
166.50 - 182.80 |
0.8584 times |
Fri 19 September 2025 |
178.64 (-4.59%) |
186.60 |
174.51 - 186.95 |
0.7445 times |
Fri 12 September 2025 |
187.23 (4.18%) |
180.40 |
179.00 - 191.00 |
2.0401 times |
Fri 05 September 2025 |
179.72 (3.16%) |
174.22 |
173.19 - 182.70 |
1.4048 times |
Fri 29 August 2025 |
174.22 (1.72%) |
170.55 |
167.98 - 176.90 |
1.4738 times |
Fri 22 August 2025 |
171.27 (10.36%) |
158.99 |
154.50 - 178.65 |
4.5493 times |

Monthly price and charts DevyaniInternational Strong monthly Stock price targets for DevyaniInternational DEVYANI are 157.48 and 170.27 | Monthly Target 1 | 154.04 | | Monthly Target 2 | 160.92 | | Monthly Target 3 | 166.83 | | Monthly Target 4 | 173.71 | | Monthly Target 5 | 179.62 |
Monthly price and volumes Devyani International
| Date |
Closing |
Open |
Range |
Volume |
Thu 30 October 2025 |
167.80 (-0.14%) |
168.94 |
159.95 - 172.74 |
0.5303 times |
Tue 30 September 2025 |
168.03 (-3.55%) |
174.22 |
166.00 - 191.00 |
1.0113 times |
Fri 29 August 2025 |
174.22 (6.82%) |
163.80 |
150.97 - 178.65 |
1.4945 times |
Thu 31 July 2025 |
163.10 (-2.78%) |
167.77 |
162.55 - 181.00 |
1.0186 times |
Mon 30 June 2025 |
167.77 (0.11%) |
170.00 |
161.67 - 175.96 |
0.5273 times |
Fri 30 May 2025 |
167.59 (-6.19%) |
177.00 |
166.09 - 190.50 |
0.7778 times |
Wed 30 April 2025 |
178.65 (19.79%) |
148.06 |
134.00 - 180.59 |
0.9194 times |
Fri 28 March 2025 |
149.14 (-9.62%) |
167.46 |
146.71 - 176.42 |
0.8955 times |
Fri 28 February 2025 |
165.02 (-2.15%) |
177.00 |
153.80 - 194.00 |
0.7952 times |
Fri 31 January 2025 |
168.65 (-7.56%) |
182.20 |
157.12 - 209.75 |
2.0301 times |
Tue 31 December 2024 |
182.45 (10.42%) |
165.49 |
161.30 - 195.00 |
1.1111 times |

DMA SMA EMA moving averages of Devyani International DEVYANI
DMA (daily moving average) of Devyani International DEVYANI
| DMA period | DMA value | | 5 day DMA | 165 | | 12 day DMA | 165.38 | | 20 day DMA | 165.51 | | 35 day DMA | 170.9 | | 50 day DMA | 172.14 | | 100 day DMA | 170.03 | | 150 day DMA | 169.4 | | 200 day DMA | 169.64 | EMA (exponential moving average) of Devyani International DEVYANI
| EMA period | EMA current | EMA prev | EMA prev2 | | 5 day EMA | 166.2 | 165.4 | 164.24 | | 12 day EMA | 165.93 | 165.59 | 165.2 | | 20 day EMA | 166.71 | 166.6 | 166.48 | | 35 day EMA | 168.04 | 168.05 | 168.07 | | 50 day EMA | 170.07 | 170.16 | 170.26 |
SMA (simple moving average) of Devyani International DEVYANI
| SMA period | SMA current | SMA prev | SMA prev2 | | 5 day SMA | 165 | 164.74 | 164.68 | | 12 day SMA | 165.38 | 164.91 | 164.56 | | 20 day SMA | 165.51 | 165.52 | 165.63 | | 35 day SMA | 170.9 | 171.43 | 171.78 | | 50 day SMA | 172.14 | 171.9 | 171.64 | | 100 day SMA | 170.03 | 170.06 | 170.07 | | 150 day SMA | 169.4 | 169.28 | 169.17 | | 200 day SMA | 169.64 | 169.76 | 169.9 |
|
|
