Delaplex DELAPLEX_SM full analysis,charts,indicators,moving averages,SMA,DMA,EMA,ADX,MACD,RSIDelaplex DELAPLEX_SM WideScreen charts, DMA,SMA,EMA technical analysis, forecast prediction, by indicators ADX,MACD,RSI,CCI NSE stock exchange
Daily price and charts and targets Delaplex Strong Daily Stock price targets for Delaplex DELAPLEX_SM are 148.85 and 156.85 | Daily Target 1 | 147.23 | | Daily Target 2 | 150.47 | | Daily Target 3 | 155.23333333333 | | Daily Target 4 | 158.47 | | Daily Target 5 | 163.23 |
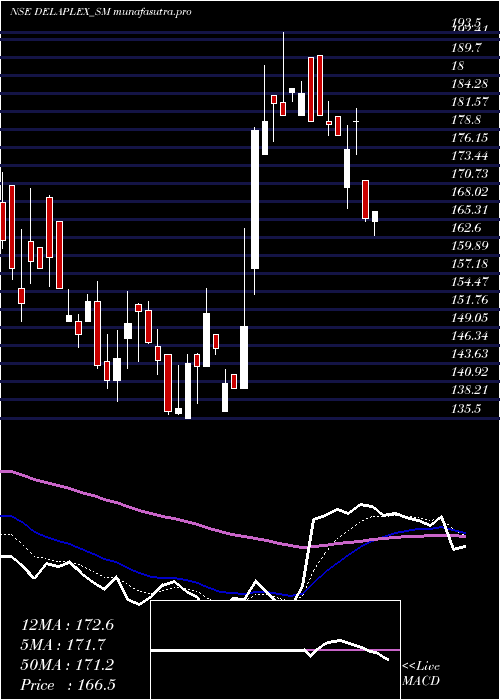
Daily price and volume Delaplex
| Date |
Closing |
Open |
Range |
Volume |
Mon 27 October 2025 |
153.70 (-4.89%) |
160.00 |
152.00 - 160.00 |
1.3971 times |
Fri 24 October 2025 |
161.60 (-2.3%) |
160.00 |
160.00 - 161.70 |
0.3676 times |
Thu 23 October 2025 |
165.40 (-0.96%) |
166.95 |
157.05 - 168.00 |
3.2353 times |
Mon 20 October 2025 |
167.00 (0%) |
167.00 |
167.00 - 167.00 |
0.1471 times |
Fri 17 October 2025 |
167.00 (-1.82%) |
173.10 |
167.00 - 173.10 |
0.2941 times |
Thu 16 October 2025 |
170.10 (-2.16%) |
173.90 |
170.00 - 173.90 |
0.3676 times |
Wed 15 October 2025 |
173.85 (3.51%) |
167.15 |
167.15 - 175.85 |
0.9559 times |
Tue 14 October 2025 |
167.95 (-2.69%) |
166.50 |
166.00 - 173.50 |
2.2794 times |
Mon 13 October 2025 |
172.60 (-3.2%) |
173.00 |
172.60 - 173.10 |
0.5147 times |
Fri 10 October 2025 |
178.30 (-3.41%) |
184.50 |
175.00 - 184.50 |
0.4412 times |
Thu 09 October 2025 |
184.60 (7.92%) |
172.25 |
172.25 - 185.00 |
0.5882 times |
Weekly price and charts Delaplex Strong weekly Stock price targets for Delaplex DELAPLEX_SM are 148.85 and 156.85 | Weekly Target 1 | 147.23 | | Weekly Target 2 | 150.47 | | Weekly Target 3 | 155.23333333333 | | Weekly Target 4 | 158.47 | | Weekly Target 5 | 163.23 |
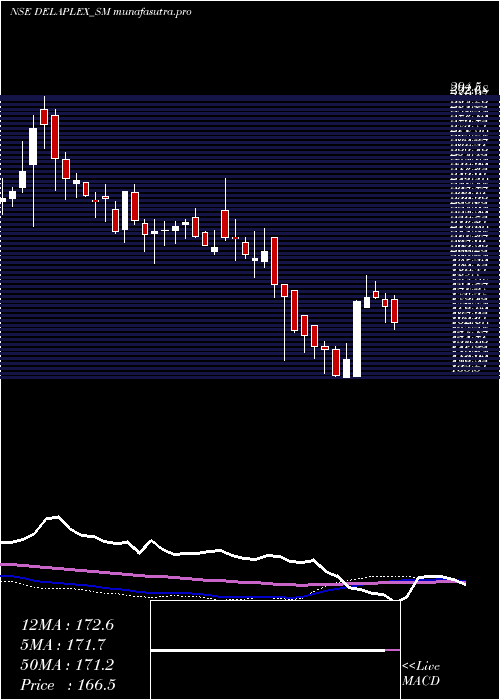
Weekly price and volumes for Delaplex
| Date |
Closing |
Open |
Range |
Volume |
Mon 27 October 2025 |
153.70 (-4.89%) |
160.00 |
152.00 - 160.00 |
0.1471 times |
Fri 24 October 2025 |
161.60 (-3.23%) |
167.00 |
157.05 - 168.00 |
0.3947 times |
Fri 17 October 2025 |
167.00 (-6.34%) |
173.00 |
166.00 - 175.85 |
0.4644 times |
Fri 10 October 2025 |
178.30 (-3.44%) |
190.00 |
166.25 - 191.60 |
1.2307 times |
Fri 03 October 2025 |
184.65 (30.22%) |
146.00 |
140.00 - 194.85 |
3.1347 times |
Fri 26 September 2025 |
141.80 (5.31%) |
135.50 |
131.00 - 155.00 |
1.5093 times |
Fri 19 September 2025 |
134.65 (2.63%) |
127.65 |
126.00 - 148.00 |
2.0046 times |
Fri 12 September 2025 |
131.20 (1.86%) |
131.00 |
128.00 - 132.50 |
0.3406 times |
Fri 05 September 2025 |
128.80 (-0.39%) |
129.00 |
126.00 - 133.95 |
0.596 times |
Fri 29 August 2025 |
129.30 (-1.45%) |
131.00 |
128.05 - 132.95 |
0.178 times |
Fri 22 August 2025 |
131.20 (-2.99%) |
137.95 |
130.00 - 139.95 |
0.7585 times |
Monthly price and charts Delaplex Strong monthly Stock price targets for Delaplex DELAPLEX_SM are 131.43 and 174.28 | Monthly Target 1 | 124 | | Monthly Target 2 | 138.85 | | Monthly Target 3 | 166.85 | | Monthly Target 4 | 181.7 | | Monthly Target 5 | 209.7 |
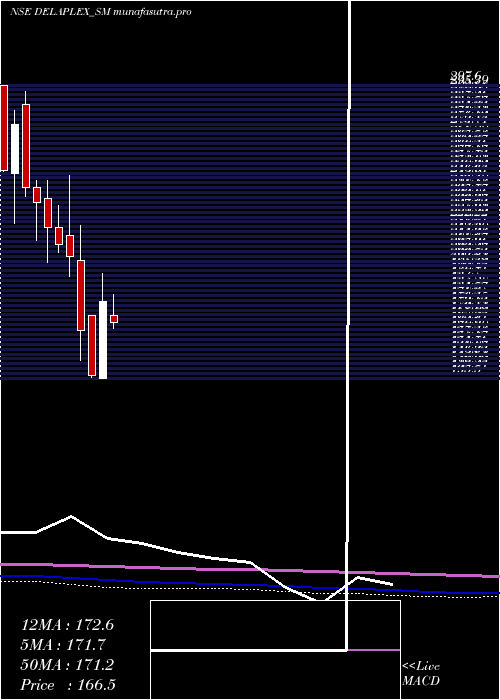
Monthly price and volumes Delaplex
| Date |
Closing |
Open |
Range |
Volume |
Mon 27 October 2025 |
153.70 (-7.91%) |
169.00 |
152.00 - 194.85 |
0.961 times |
Tue 30 September 2025 |
166.90 (29.08%) |
129.00 |
126.00 - 171.60 |
1.6172 times |
Fri 29 August 2025 |
129.30 (-9.55%) |
140.55 |
128.05 - 142.60 |
0.4124 times |
Thu 31 July 2025 |
142.95 (-4.95%) |
151.00 |
141.00 - 160.90 |
1.0199 times |
Mon 30 June 2025 |
150.40 (-18.46%) |
174.60 |
145.00 - 174.60 |
0.9183 times |
Fri 30 May 2025 |
184.45 (3.62%) |
170.15 |
153.00 - 186.05 |
0.6867 times |
Tue 29 April 2025 |
178.00 (29.97%) |
135.50 |
135.50 - 193.50 |
0.8289 times |
Fri 28 March 2025 |
136.95 (-15.54%) |
170.50 |
136.00 - 170.50 |
1.6883 times |
Fri 28 February 2025 |
162.15 (-20.12%) |
201.05 |
145.35 - 220.00 |
0.8147 times |
Fri 31 January 2025 |
203.00 (-3.26%) |
214.80 |
192.00 - 248.00 |
1.0524 times |
Tue 31 December 2024 |
209.85 (-4.13%) |
218.90 |
205.25 - 231.25 |
0.9386 times |
DMA SMA EMA moving averages of Delaplex DELAPLEX_SM
DMA (daily moving average) of Delaplex DELAPLEX_SM
| DMA period | DMA value | | 5 day DMA | 162.94 | | 12 day DMA | 169.43 | | 20 day DMA | 166.76 | | 35 day DMA | 152.35 | | 50 day DMA | 146.65 | | 100 day DMA | 147.52 | | 150 day DMA | 152.95 | | 200 day DMA | 163.83 | EMA (exponential moving average) of Delaplex DELAPLEX_SM
| EMA period | EMA current | EMA prev | EMA prev2 | | 5 day EMA | 161.8 | 165.85 | 167.97 | | 12 day EMA | 164.79 | 166.81 | 167.76 | | 20 day EMA | 162.49 | 163.41 | 163.6 | | 35 day EMA | 156.62 | 156.79 | 156.51 | | 50 day EMA | 147.63 | 147.38 | 146.8 |
SMA (simple moving average) of Delaplex DELAPLEX_SM
| SMA period | SMA current | SMA prev | SMA prev2 | | 5 day SMA | 162.94 | 166.22 | 168.67 | | 12 day SMA | 169.43 | 170.92 | 172.24 | | 20 day SMA | 166.76 | 165.7 | 164.37 | | 35 day SMA | 152.35 | 151.66 | 150.8 | | 50 day SMA | 146.65 | 146.32 | 145.89 | | 100 day SMA | 147.52 | 147.61 | 147.84 | | 150 day SMA | 152.95 | 152.96 | 152.95 | | 200 day SMA | 163.83 | 164.12 | 164.36 |
|
|
