DeccanTranscon DECCANTRAN_SM full analysis,charts,indicators,moving averages,SMA,DMA,EMA,ADX,MACD,RSIDeccan Transcon DECCANTRAN_SM WideScreen charts, DMA,SMA,EMA technical analysis, forecast prediction, by indicators ADX,MACD,RSI,CCI NSE stock exchange
Daily price and charts and targets DeccanTranscon Strong Daily Stock price targets for DeccanTranscon DECCANTRAN_SM are 33.3 and 33.3 | Daily Target 1 | 33.3 | | Daily Target 2 | 33.3 | | Daily Target 3 | 33.3 | | Daily Target 4 | 33.3 | | Daily Target 5 | 33.3 |
Daily price and volume Deccan Transcon
| Date |
Closing |
Open |
Range |
Volume |
Tue 28 October 2025 |
33.30 (-1.33%) |
33.30 |
33.30 - 33.30 |
0.5556 times |
Mon 27 October 2025 |
33.75 (1.05%) |
32.40 |
32.40 - 34.70 |
3.8889 times |
Fri 24 October 2025 |
33.40 (3.41%) |
31.60 |
31.60 - 33.50 |
2.0833 times |
Thu 23 October 2025 |
32.30 (-0.31%) |
32.40 |
32.30 - 32.40 |
0.4167 times |
Tue 21 October 2025 |
32.40 (0%) |
32.40 |
32.40 - 32.40 |
0.2778 times |
Mon 20 October 2025 |
32.40 (1.09%) |
31.00 |
31.00 - 32.40 |
0.5556 times |
Fri 17 October 2025 |
32.05 (0%) |
32.05 |
32.05 - 32.05 |
0.1389 times |
Thu 16 October 2025 |
32.05 (0%) |
32.05 |
32.05 - 32.05 |
0.1389 times |
Wed 15 October 2025 |
32.05 (-1.38%) |
31.70 |
31.60 - 32.05 |
1.5278 times |
Tue 14 October 2025 |
32.50 (-1.52%) |
33.00 |
32.50 - 33.00 |
0.4167 times |
Mon 13 October 2025 |
33.00 (2.17%) |
33.00 |
33.00 - 33.00 |
0.1389 times |
Weekly price and charts DeccanTranscon Strong weekly Stock price targets for DeccanTranscon DECCANTRAN_SM are 32.85 and 35.15 | Weekly Target 1 | 31.17 | | Weekly Target 2 | 32.23 | | Weekly Target 3 | 33.466666666667 | | Weekly Target 4 | 34.53 | | Weekly Target 5 | 35.77 |
Weekly price and volumes for Deccan Transcon
| Date |
Closing |
Open |
Range |
Volume |
Tue 28 October 2025 |
33.30 (-0.3%) |
32.40 |
32.40 - 34.70 |
0.9786 times |
Fri 24 October 2025 |
33.40 (4.21%) |
31.00 |
31.00 - 33.50 |
0.7339 times |
Fri 17 October 2025 |
32.05 (-0.77%) |
33.00 |
31.60 - 33.00 |
0.5199 times |
Fri 10 October 2025 |
32.30 (-1.52%) |
32.50 |
32.00 - 32.90 |
0.581 times |
Fri 03 October 2025 |
32.80 (-3.53%) |
33.70 |
32.00 - 33.70 |
1.7125 times |
Fri 26 September 2025 |
34.00 (-2.58%) |
34.90 |
34.00 - 35.85 |
0.6422 times |
Fri 19 September 2025 |
34.90 (-7.67%) |
36.70 |
34.00 - 37.30 |
1.6208 times |
Fri 12 September 2025 |
37.80 (1.2%) |
38.00 |
36.15 - 38.65 |
0.948 times |
Fri 05 September 2025 |
37.35 (0.81%) |
36.70 |
35.75 - 38.30 |
0.8257 times |
Fri 29 August 2025 |
37.05 (-2.24%) |
38.00 |
36.75 - 39.90 |
1.4373 times |
Fri 22 August 2025 |
37.90 (17.16%) |
32.90 |
32.35 - 42.95 |
8.6239 times |
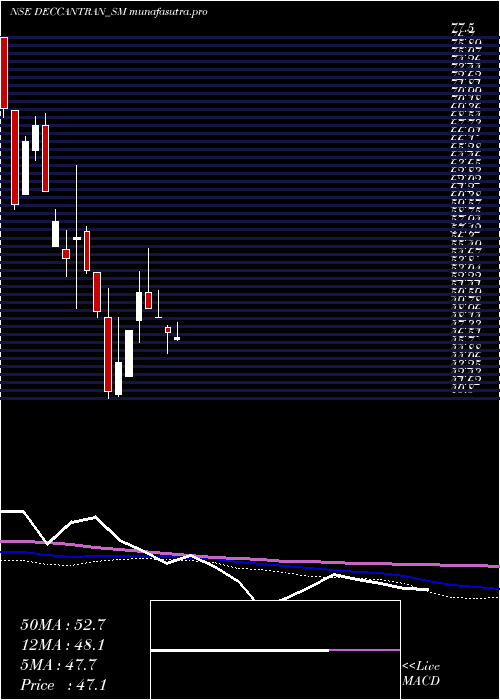
Monthly price and charts DeccanTranscon Strong monthly Stock price targets for DeccanTranscon DECCANTRAN_SM are 32.15 and 35.85 | Monthly Target 1 | 29.3 | | Monthly Target 2 | 31.3 | | Monthly Target 3 | 33 | | Monthly Target 4 | 35 | | Monthly Target 5 | 36.7 |
Monthly price and volumes Deccan Transcon
| Date |
Closing |
Open |
Range |
Volume |
Tue 28 October 2025 |
33.30 (2.78%) |
32.70 |
31.00 - 34.70 |
0.2342 times |
Tue 30 September 2025 |
32.40 (-12.55%) |
36.70 |
32.40 - 38.65 |
0.336 times |
Fri 29 August 2025 |
37.05 (14.18%) |
32.50 |
30.00 - 42.95 |
0.8817 times |
Thu 31 July 2025 |
32.45 (-17.74%) |
41.50 |
28.80 - 41.50 |
2.0729 times |
Mon 30 June 2025 |
39.45 (-3.78%) |
41.10 |
35.60 - 43.00 |
0.5335 times |
Fri 30 May 2025 |
41.00 (-16.41%) |
48.05 |
39.05 - 48.90 |
0.6577 times |
Wed 30 April 2025 |
49.05 (18.05%) |
41.25 |
41.00 - 56.10 |
1.01 times |
Fri 28 March 2025 |
41.55 (-24.45%) |
57.00 |
40.80 - 64.50 |
3.2091 times |
Fri 28 February 2025 |
55.00 (-11%) |
56.25 |
53.20 - 60.00 |
0.5152 times |
Wed 13 November 2024 |
61.80 (-6.22%) |
67.45 |
61.80 - 69.80 |
0.5498 times |
Thu 31 October 2024 |
65.90 (0%) |
77.80 |
60.05 - 81.90 |
3.1989 times |

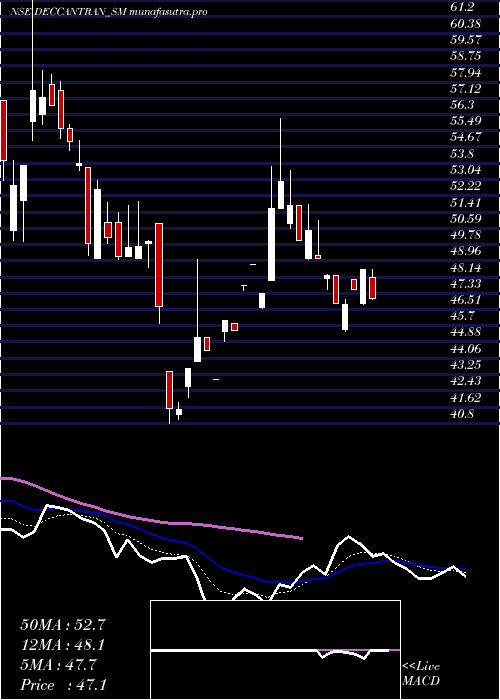
DMA SMA EMA moving averages of Deccan Transcon DECCANTRAN_SM
DMA (daily moving average) of Deccan Transcon DECCANTRAN_SM
| DMA period | DMA value | | 5 day DMA | 33.03 | | 12 day DMA | 32.63 | | 20 day DMA | 32.91 | | 35 day DMA | 34.33 | | 50 day DMA | 34.8 | | 100 day DMA | 36.73 | | 150 day DMA | 40.85 | | 200 day DMA | | EMA (exponential moving average) of Deccan Transcon DECCANTRAN_SM
| EMA period | EMA current | EMA prev | EMA prev2 | | 5 day EMA | 33.13 | 33.04 | 32.68 | | 12 day EMA | 32.96 | 32.9 | 32.75 | | 20 day EMA | 33.22 | 33.21 | 33.15 | | 35 day EMA | 33.66 | 33.68 | 33.68 | | 50 day EMA | 34.38 | 34.42 | 34.45 |
SMA (simple moving average) of Deccan Transcon DECCANTRAN_SM
| SMA period | SMA current | SMA prev | SMA prev2 | | 5 day SMA | 33.03 | 32.85 | 32.51 | | 12 day SMA | 32.63 | 32.56 | 32.48 | | 20 day SMA | 32.91 | 33 | 33.05 | | 35 day SMA | 34.33 | 34.42 | 34.52 | | 50 day SMA | 34.8 | 34.76 | 34.71 | | 100 day SMA | 36.73 | 36.86 | 36.99 | | 150 day SMA | 40.85 | 41 | 41.16 | | 200 day SMA |
|
|
