DeccanCements DECCANCE full analysis,charts,indicators,moving averages,SMA,DMA,EMA,ADX,MACD,RSIDeccan Cements DECCANCE WideScreen charts, DMA,SMA,EMA technical analysis, forecast prediction, by indicators ADX,MACD,RSI,CCI NSE stock exchange
operates under Cement & Cement Products sector
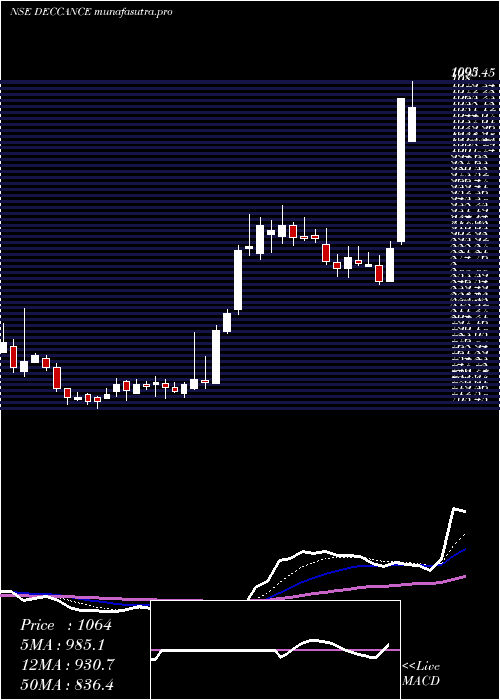
Daily price and charts and targets DeccanCements Strong Daily Stock price targets for DeccanCements DECCANCE are 1029.55 and 1059.65 | Daily Target 1 | 1007.97 | | Daily Target 2 | 1021.03 | | Daily Target 3 | 1038.0666666667 | | Daily Target 4 | 1051.13 | | Daily Target 5 | 1068.17 |
Daily price and volume Deccan Cements
| Date |
Closing |
Open |
Range |
Volume |
Tue 28 October 2025 |
1034.10 (1.02%) |
1032.90 |
1025.00 - 1055.10 |
0.5132 times |
Mon 27 October 2025 |
1023.70 (-0.56%) |
1036.20 |
1015.30 - 1036.20 |
0.4521 times |
Fri 24 October 2025 |
1029.50 (-1.77%) |
1046.10 |
1022.30 - 1056.90 |
0.7747 times |
Thu 23 October 2025 |
1048.10 (0.18%) |
1056.00 |
1039.50 - 1066.40 |
0.8239 times |
Tue 21 October 2025 |
1046.20 (1.4%) |
1031.80 |
1031.80 - 1093.00 |
0.3939 times |
Mon 20 October 2025 |
1031.80 (-1.21%) |
1044.40 |
1013.50 - 1050.90 |
0.7575 times |
Fri 17 October 2025 |
1044.40 (-2.86%) |
1075.10 |
1038.10 - 1088.80 |
1.4768 times |
Thu 16 October 2025 |
1075.20 (5.93%) |
1020.00 |
1010.10 - 1098.00 |
3.4175 times |
Wed 15 October 2025 |
1015.00 (2.29%) |
992.30 |
992.30 - 1022.00 |
0.6625 times |
Tue 14 October 2025 |
992.30 (-2.19%) |
1014.00 |
989.50 - 1022.60 |
0.728 times |
Mon 13 October 2025 |
1014.50 (1.59%) |
1001.20 |
1001.20 - 1038.00 |
2.2084 times |
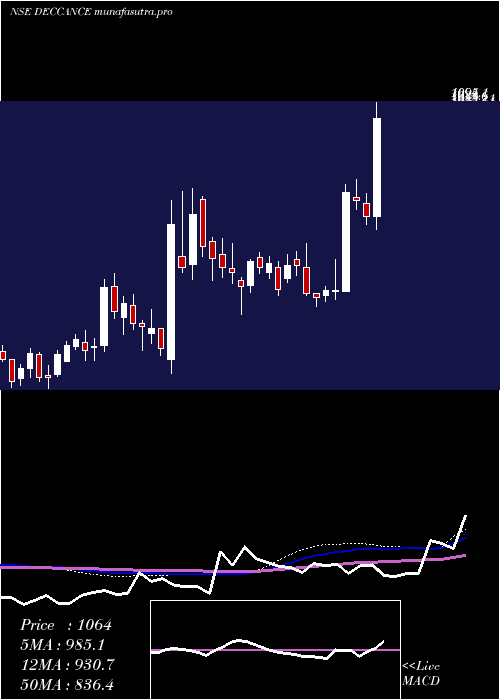
Weekly price and charts DeccanCements Strong weekly Stock price targets for DeccanCements DECCANCE are 1004.8 and 1044.6 | Weekly Target 1 | 995.03 | | Weekly Target 2 | 1014.57 | | Weekly Target 3 | 1034.8333333333 | | Weekly Target 4 | 1054.37 | | Weekly Target 5 | 1074.63 |
Weekly price and volumes for Deccan Cements
| Date |
Closing |
Open |
Range |
Volume |
Tue 28 October 2025 |
1034.10 (0.45%) |
1036.20 |
1015.30 - 1055.10 |
0.1348 times |
Fri 24 October 2025 |
1029.50 (-1.43%) |
1044.40 |
1013.50 - 1093.00 |
0.384 times |
Fri 17 October 2025 |
1044.40 (4.59%) |
1001.20 |
989.50 - 1098.00 |
1.186 times |
Fri 10 October 2025 |
998.60 (-7.67%) |
1100.00 |
984.60 - 1100.00 |
0.869 times |
Fri 03 October 2025 |
1081.60 (-0.31%) |
1093.70 |
1067.80 - 1128.30 |
0.7901 times |
Fri 26 September 2025 |
1085.00 (-3.21%) |
1130.00 |
1075.00 - 1158.00 |
1.8606 times |
Fri 19 September 2025 |
1121.00 (4.69%) |
1065.00 |
1060.70 - 1134.50 |
0.8498 times |
Fri 12 September 2025 |
1070.80 (-1.05%) |
1104.00 |
1060.60 - 1164.90 |
1.4907 times |
Fri 05 September 2025 |
1082.20 (7.11%) |
1014.40 |
1011.90 - 1150.00 |
1.6299 times |
Fri 29 August 2025 |
1010.40 (-4.02%) |
1061.10 |
1003.30 - 1099.70 |
0.8051 times |
Fri 22 August 2025 |
1052.70 (0.49%) |
1075.00 |
1020.10 - 1090.00 |
0.9639 times |
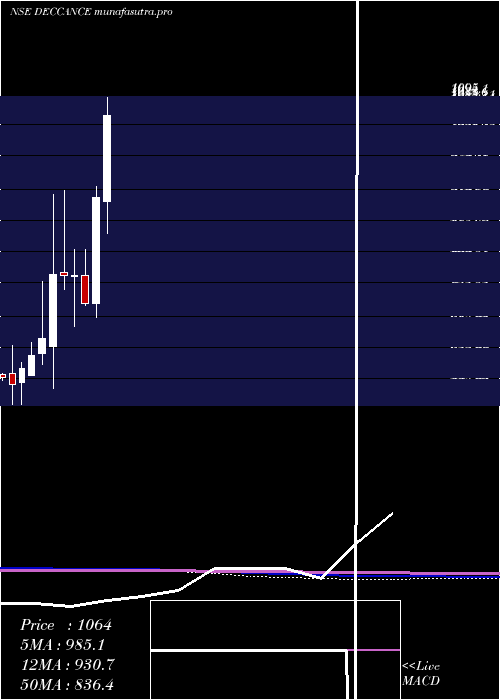
Monthly price and charts DeccanCements Strong monthly Stock price targets for DeccanCements DECCANCE are 939.5 and 1079.2 | Monthly Target 1 | 907.97 | | Monthly Target 2 | 971.03 | | Monthly Target 3 | 1047.6666666667 | | Monthly Target 4 | 1110.73 | | Monthly Target 5 | 1187.37 |
Monthly price and volumes Deccan Cements
| Date |
Closing |
Open |
Range |
Volume |
Tue 28 October 2025 |
1034.10 (-6.51%) |
1102.00 |
984.60 - 1124.30 |
0.7134 times |
Tue 30 September 2025 |
1106.10 (9.47%) |
1014.40 |
1011.90 - 1164.90 |
1.5264 times |
Fri 29 August 2025 |
1010.40 (-4.3%) |
1064.00 |
1002.90 - 1099.90 |
0.9368 times |
Thu 31 July 2025 |
1055.85 (15.12%) |
910.00 |
853.05 - 1109.30 |
2.4948 times |
Mon 30 June 2025 |
917.15 (25.71%) |
729.55 |
705.45 - 937.30 |
1.0261 times |
Fri 30 May 2025 |
729.55 (-6.29%) |
778.55 |
725.60 - 825.00 |
0.4345 times |
Wed 30 April 2025 |
778.55 (-0.06%) |
778.45 |
689.70 - 826.15 |
0.2229 times |
Fri 28 March 2025 |
779.00 (-0.17%) |
785.10 |
755.00 - 930.00 |
0.7264 times |
Fri 28 February 2025 |
780.30 (16.86%) |
654.00 |
577.95 - 924.00 |
1.318 times |
Fri 31 January 2025 |
667.75 (4.77%) |
640.70 |
621.15 - 769.00 |
0.6007 times |
Tue 31 December 2024 |
637.35 (3.84%) |
601.60 |
601.10 - 660.00 |
0.1467 times |
DMA SMA EMA moving averages of Deccan Cements DECCANCE
DMA (daily moving average) of Deccan Cements DECCANCE
| DMA period | DMA value | | 5 day DMA | 1036.32 | | 12 day DMA | 1029.45 | | 20 day DMA | 1042.24 | | 35 day DMA | 1067.94 | | 50 day DMA | 1065.59 | | 100 day DMA | 992.2 | | 150 day DMA | 918.89 | | 200 day DMA | 870.3 | EMA (exponential moving average) of Deccan Cements DECCANCE
| EMA period | EMA current | EMA prev | EMA prev2 | | 5 day EMA | 1033.47 | 1033.16 | 1037.89 | | 12 day EMA | 1037.38 | 1037.98 | 1040.57 | | 20 day EMA | 1044.46 | 1045.55 | 1047.85 | | 35 day EMA | 1050.89 | 1051.88 | 1053.54 | | 50 day EMA | 1061.94 | 1063.08 | 1064.69 |
SMA (simple moving average) of Deccan Cements DECCANCE
| SMA period | SMA current | SMA prev | SMA prev2 | | 5 day SMA | 1036.32 | 1035.86 | 1040 | | 12 day SMA | 1029.45 | 1027.61 | 1028.59 | | 20 day SMA | 1042.24 | 1044.78 | 1049.68 | | 35 day SMA | 1067.94 | 1069.32 | 1071.23 | | 50 day SMA | 1065.59 | 1066.3 | 1067.04 | | 100 day SMA | 992.2 | 988.99 | 985.94 | | 150 day SMA | 918.89 | 917.21 | 915.47 | | 200 day SMA | 870.3 | 868.68 | 867.27 |
|
|
