DcgCables DCG_SM full analysis,charts,indicators,moving averages,SMA,DMA,EMA,ADX,MACD,RSIDcg Cables DCG_SM WideScreen charts, DMA,SMA,EMA technical analysis, forecast prediction, by indicators ADX,MACD,RSI,CCI NSE stock exchange
Daily price and charts and targets DcgCables Strong Daily Stock price targets for DcgCables DCG_SM are 62.25 and 64.75 | Daily Target 1 | 60.33 | | Daily Target 2 | 61.67 | | Daily Target 3 | 62.833333333333 | | Daily Target 4 | 64.17 | | Daily Target 5 | 65.33 |
Daily price and volume Dcg Cables
| Date |
Closing |
Open |
Range |
Volume |
Tue 28 October 2025 |
63.00 (0.08%) |
62.95 |
61.50 - 64.00 |
0.5333 times |
Mon 27 October 2025 |
62.95 (0.8%) |
63.95 |
59.10 - 63.95 |
1.6 times |
Fri 24 October 2025 |
62.45 (-2.04%) |
63.80 |
61.50 - 64.00 |
0.8 times |
Thu 23 October 2025 |
63.75 (5.37%) |
60.00 |
60.00 - 64.50 |
0.6 times |
Tue 21 October 2025 |
60.50 (-1.63%) |
60.00 |
60.00 - 60.65 |
0.4667 times |
Mon 20 October 2025 |
61.50 (0%) |
61.50 |
60.05 - 61.50 |
0.8 times |
Fri 17 October 2025 |
61.50 (-0.08%) |
63.00 |
60.50 - 63.00 |
0.4667 times |
Thu 16 October 2025 |
61.55 (-4.35%) |
63.00 |
55.00 - 63.00 |
4.0667 times |
Wed 15 October 2025 |
64.35 (-2.13%) |
66.40 |
64.10 - 66.40 |
0.2 times |
Tue 14 October 2025 |
65.75 (-0.15%) |
65.00 |
64.00 - 66.00 |
0.4667 times |
Mon 13 October 2025 |
65.85 (1.15%) |
65.10 |
64.55 - 65.85 |
0.2 times |
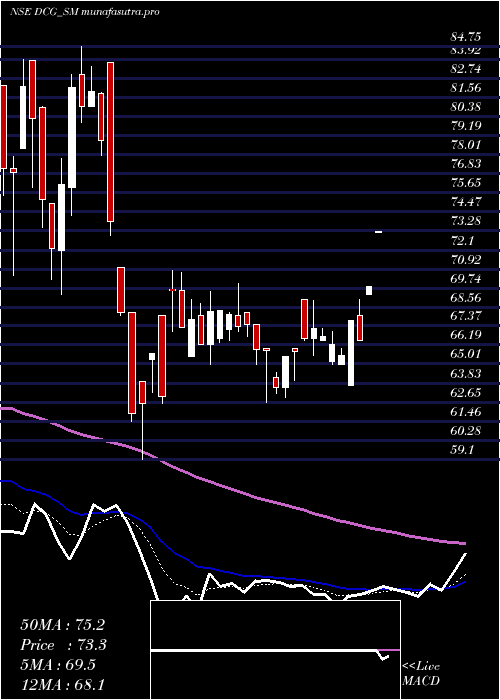
Weekly price and charts DcgCables Strong weekly Stock price targets for DcgCables DCG_SM are 58.6 and 63.5 | Weekly Target 1 | 57.13 | | Weekly Target 2 | 60.07 | | Weekly Target 3 | 62.033333333333 | | Weekly Target 4 | 64.97 | | Weekly Target 5 | 66.93 |
Weekly price and volumes for Dcg Cables
| Date |
Closing |
Open |
Range |
Volume |
Tue 28 October 2025 |
63.00 (0.88%) |
63.95 |
59.10 - 64.00 |
0.6049 times |
Fri 24 October 2025 |
62.45 (1.54%) |
61.50 |
60.00 - 64.50 |
0.7561 times |
Fri 17 October 2025 |
61.50 (-5.53%) |
65.10 |
55.00 - 66.40 |
1.5312 times |
Fri 10 October 2025 |
65.10 (-4.05%) |
67.35 |
64.00 - 67.45 |
1.3043 times |
Fri 03 October 2025 |
67.85 (1.12%) |
69.05 |
66.95 - 69.45 |
0.8318 times |
Fri 26 September 2025 |
67.10 (-1.97%) |
68.45 |
66.30 - 72.00 |
1.2665 times |
Fri 19 September 2025 |
68.45 (0.51%) |
68.10 |
66.00 - 68.45 |
0.794 times |
Fri 12 September 2025 |
68.10 (-7.97%) |
74.90 |
68.00 - 74.90 |
1.6068 times |
Fri 05 September 2025 |
74.00 (4.96%) |
70.50 |
68.00 - 74.00 |
0.9074 times |
Fri 29 August 2025 |
70.50 (-3.03%) |
70.00 |
67.70 - 71.50 |
0.397 times |
Fri 22 August 2025 |
72.70 (-2.35%) |
74.45 |
70.70 - 75.00 |
0.5482 times |
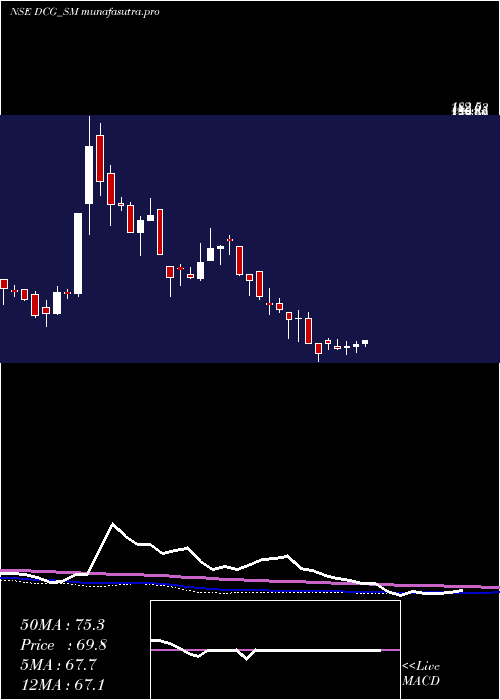
Monthly price and charts DcgCables Strong monthly Stock price targets for DcgCables DCG_SM are 52.05 and 65.95 | Monthly Target 1 | 48.4 | | Monthly Target 2 | 55.7 | | Monthly Target 3 | 62.3 | | Monthly Target 4 | 69.6 | | Monthly Target 5 | 76.2 |
Monthly price and volumes Dcg Cables
| Date |
Closing |
Open |
Range |
Volume |
Tue 28 October 2025 |
63.00 (-8.56%) |
68.85 |
55.00 - 68.90 |
0.5775 times |
Tue 30 September 2025 |
68.90 (-2.27%) |
70.50 |
66.00 - 74.90 |
0.6603 times |
Fri 29 August 2025 |
70.50 (-6.25%) |
78.00 |
67.70 - 78.00 |
0.2558 times |
Thu 31 July 2025 |
75.20 (14.2%) |
64.15 |
62.95 - 80.40 |
0.6823 times |
Mon 30 June 2025 |
65.85 (4.52%) |
69.65 |
62.65 - 70.80 |
0.4362 times |
Thu 06 March 2025 |
63.00 (-7.62%) |
68.20 |
59.10 - 68.20 |
0.4581 times |
Fri 28 February 2025 |
68.20 (-22.46%) |
88.50 |
68.00 - 90.80 |
1.3134 times |
Fri 31 January 2025 |
87.95 (-24.96%) |
117.20 |
82.95 - 120.45 |
1.7495 times |
Tue 31 December 2024 |
117.20 (10.67%) |
103.00 |
100.00 - 126.40 |
1.7666 times |
Fri 29 November 2024 |
105.90 (-18.03%) |
132.15 |
92.00 - 141.10 |
2.1004 times |
Thu 31 October 2024 |
129.20 (-13.08%) |
131.90 |
112.75 - 141.85 |
1.2451 times |
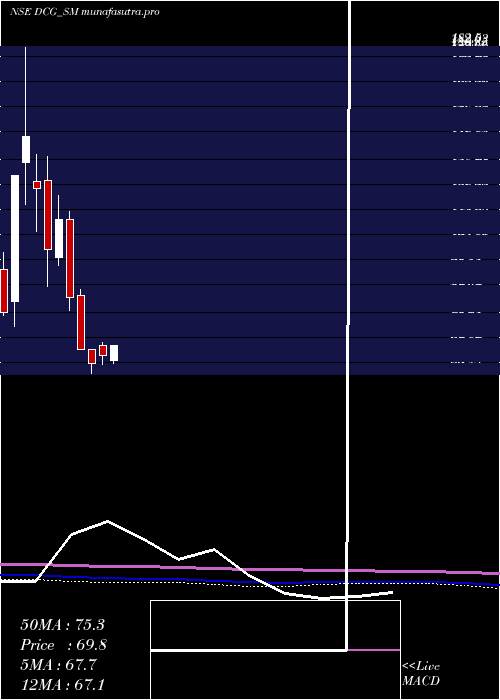
DMA SMA EMA moving averages of Dcg Cables DCG_SM
DMA (daily moving average) of Dcg Cables DCG_SM
| DMA period | DMA value | | 5 day DMA | 62.53 | | 12 day DMA | 63.19 | | 20 day DMA | 64.92 | | 35 day DMA | 66.53 | | 50 day DMA | 67.93 | | 100 day DMA | 69.13 | | 150 day DMA | 78.69 | | 200 day DMA | 89.64 | EMA (exponential moving average) of Dcg Cables DCG_SM
| EMA period | EMA current | EMA prev | EMA prev2 | | 5 day EMA | 62.77 | 62.66 | 62.52 | | 12 day EMA | 63.45 | 63.53 | 63.64 | | 20 day EMA | 64.52 | 64.68 | 64.86 | | 35 day EMA | 66.2 | 66.39 | 66.59 | | 50 day EMA | 67.87 | 68.07 | 68.28 |
SMA (simple moving average) of Dcg Cables DCG_SM
| SMA period | SMA current | SMA prev | SMA prev2 | | 5 day SMA | 62.53 | 62.23 | 61.94 | | 12 day SMA | 63.19 | 63.53 | 63.78 | | 20 day SMA | 64.92 | 65.12 | 65.44 | | 35 day SMA | 66.53 | 66.84 | 67.09 | | 50 day SMA | 67.93 | 68.16 | 68.36 | | 100 day SMA | 69.13 | 69.32 | 69.5 | | 150 day SMA | 78.69 | 79 | 79.33 | | 200 day SMA | 89.64 | 90.12 | 90.58 |
|
|
