DhampurBio DBOL full analysis,charts,indicators,moving averages,SMA,DMA,EMA,ADX,MACD,RSIDhampur Bio DBOL WideScreen charts, DMA,SMA,EMA technical analysis, forecast prediction, by indicators ADX,MACD,RSI,CCI NSE stock exchange
Daily price and charts and targets DhampurBio Strong Daily Stock price targets for DhampurBio DBOL are 78.91 and 81.27 | Daily Target 1 | 76.98 | | Daily Target 2 | 78.48 | | Daily Target 3 | 79.336666666667 | | Daily Target 4 | 80.84 | | Daily Target 5 | 81.7 |
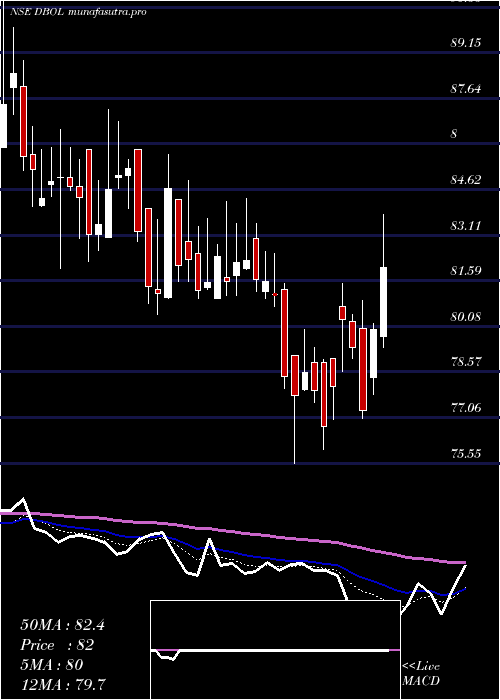
Daily price and volume Dhampur Bio
| Date |
Closing |
Open |
Range |
Volume |
Tue 28 October 2025 |
79.99 (3.49%) |
78.40 |
77.83 - 80.19 |
1.1173 times |
Mon 27 October 2025 |
77.29 (-2.63%) |
80.00 |
77.03 - 80.93 |
2.8297 times |
Fri 24 October 2025 |
79.38 (-1.16%) |
80.25 |
79.00 - 80.49 |
0.6747 times |
Thu 23 October 2025 |
80.31 (2.84%) |
80.75 |
78.58 - 81.50 |
1.0858 times |
Tue 21 October 2025 |
78.09 (1.73%) |
79.00 |
77.00 - 79.00 |
0.1936 times |
Mon 20 October 2025 |
76.76 (-1.53%) |
78.88 |
76.00 - 78.99 |
0.4297 times |
Fri 17 October 2025 |
77.95 (-0.78%) |
78.89 |
77.55 - 79.39 |
0.3442 times |
Thu 16 October 2025 |
78.56 (1%) |
77.98 |
77.94 - 79.99 |
0.569 times |
Wed 15 October 2025 |
77.78 (-0.8%) |
79.12 |
75.55 - 79.12 |
1.9309 times |
Tue 14 October 2025 |
78.41 (-3.34%) |
81.30 |
78.01 - 81.49 |
0.8251 times |
Mon 13 October 2025 |
81.12 (-0.54%) |
81.14 |
80.75 - 82.49 |
0.4355 times |
Weekly price and charts DhampurBio Strong weekly Stock price targets for DhampurBio DBOL are 76.56 and 80.46 | Weekly Target 1 | 75.42 | | Weekly Target 2 | 77.7 | | Weekly Target 3 | 79.316666666667 | | Weekly Target 4 | 81.6 | | Weekly Target 5 | 83.22 |
Weekly price and volumes for Dhampur Bio
| Date |
Closing |
Open |
Range |
Volume |
Tue 28 October 2025 |
79.99 (0.77%) |
80.00 |
77.03 - 80.93 |
1.076 times |
Fri 24 October 2025 |
79.38 (1.83%) |
78.88 |
76.00 - 81.50 |
0.6499 times |
Fri 17 October 2025 |
77.95 (-4.43%) |
81.14 |
75.55 - 82.49 |
1.119 times |
Fri 10 October 2025 |
81.56 (-1%) |
81.71 |
81.01 - 84.30 |
0.9536 times |
Fri 03 October 2025 |
82.38 (0.34%) |
82.90 |
81.00 - 84.90 |
0.7962 times |
Fri 26 September 2025 |
82.10 (-3.76%) |
85.94 |
80.49 - 85.94 |
1.6871 times |
Fri 19 September 2025 |
85.31 (1.15%) |
85.95 |
82.21 - 87.28 |
1.1557 times |
Fri 12 September 2025 |
84.34 (-1.1%) |
84.10 |
81.98 - 86.62 |
0.514 times |
Fri 05 September 2025 |
85.28 (-0.13%) |
84.25 |
84.04 - 92.85 |
1.0769 times |
Fri 29 August 2025 |
85.39 (-3.28%) |
88.30 |
83.00 - 88.97 |
0.9715 times |
Fri 22 August 2025 |
88.29 (-1.94%) |
91.70 |
87.10 - 93.00 |
1.4901 times |

Monthly price and charts DhampurBio Strong monthly Stock price targets for DhampurBio DBOL are 73.4 and 82.15 | Monthly Target 1 | 71.2 | | Monthly Target 2 | 75.59 | | Monthly Target 3 | 79.946666666667 | | Monthly Target 4 | 84.34 | | Monthly Target 5 | 88.7 |
Monthly price and volumes Dhampur Bio
| Date |
Closing |
Open |
Range |
Volume |
Tue 28 October 2025 |
79.99 (-1.59%) |
81.38 |
75.55 - 84.30 |
0.4865 times |
Tue 30 September 2025 |
81.28 (-4.81%) |
84.25 |
80.49 - 92.85 |
0.5694 times |
Fri 29 August 2025 |
85.39 (8.07%) |
78.50 |
73.65 - 93.00 |
0.7404 times |
Thu 31 July 2025 |
79.01 (30.92%) |
95.50 |
78.02 - 104.90 |
1.2319 times |
Tue 04 March 2025 |
60.35 (-3.1%) |
62.28 |
58.46 - 63.89 |
0.2358 times |
Fri 28 February 2025 |
62.28 (-32.93%) |
91.00 |
61.06 - 92.38 |
2.1758 times |
Fri 31 January 2025 |
92.86 (-18.31%) |
114.00 |
89.39 - 119.00 |
1.1442 times |
Tue 31 December 2024 |
113.67 (-11.96%) |
129.11 |
111.00 - 133.93 |
0.8534 times |
Fri 29 November 2024 |
129.11 (-4.44%) |
135.69 |
119.36 - 139.38 |
0.7956 times |
Thu 31 October 2024 |
135.11 (-15.53%) |
159.99 |
122.32 - 163.85 |
1.767 times |
Mon 30 September 2024 |
159.95 (13.54%) |
141.60 |
128.50 - 163.93 |
3.4393 times |

DMA SMA EMA moving averages of Dhampur Bio DBOL
DMA (daily moving average) of Dhampur Bio DBOL
| DMA period | DMA value | | 5 day DMA | 79.01 | | 12 day DMA | 78.93 | | 20 day DMA | 80.12 | | 35 day DMA | 81.7 | | 50 day DMA | 83.5 | | 100 day DMA | 82.77 | | 150 day DMA | 94.65 | | 200 day DMA | 105.86 | EMA (exponential moving average) of Dhampur Bio DBOL
| EMA period | EMA current | EMA prev | EMA prev2 | | 5 day EMA | 78.96 | 78.45 | 79.03 | | 12 day EMA | 79.3 | 79.17 | 79.51 | | 20 day EMA | 80.05 | 80.06 | 80.35 | | 35 day EMA | 81.43 | 81.51 | 81.76 | | 50 day EMA | 82.88 | 83 | 83.23 |
SMA (simple moving average) of Dhampur Bio DBOL
| SMA period | SMA current | SMA prev | SMA prev2 | | 5 day SMA | 79.01 | 78.37 | 78.5 | | 12 day SMA | 78.93 | 79.07 | 79.48 | | 20 day SMA | 80.12 | 80.22 | 80.59 | | 35 day SMA | 81.7 | 81.86 | 82.1 | | 50 day SMA | 83.5 | 83.61 | 83.72 | | 100 day SMA | 82.77 | 82.98 | 83.24 | | 150 day SMA | 94.65 | 95 | 95.4 | | 200 day SMA | 105.86 | 106.16 | 106.45 |
|
|
