DB DBCORP full analysis,charts,indicators,moving averages,SMA,DMA,EMA,ADX,MACD,RSID B DBCORP WideScreen charts, DMA,SMA,EMA technical analysis, forecast prediction, by indicators ADX,MACD,RSI,CCI NSE stock exchange
operates under Publishing sector
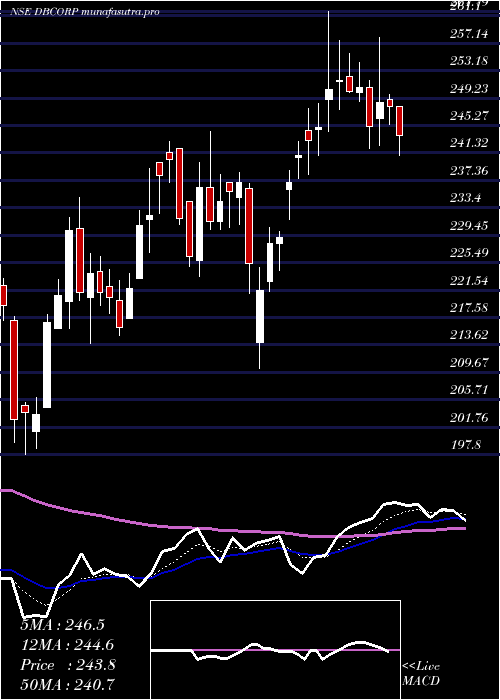
Daily price and charts and targets DB Strong Daily Stock price targets for DB DBCORP are 253.3 and 263.75 | Daily Target 1 | 250.9 | | Daily Target 2 | 255.7 | | Daily Target 3 | 261.35 | | Daily Target 4 | 266.15 | | Daily Target 5 | 271.8 |
Daily price and volume D B
| Date |
Closing |
Open |
Range |
Volume |
Tue 28 October 2025 |
260.50 (-3.38%) |
266.10 |
256.55 - 267.00 |
1.0702 times |
Mon 27 October 2025 |
269.60 (4.13%) |
257.90 |
255.50 - 280.55 |
1.4741 times |
Fri 24 October 2025 |
258.90 (0.47%) |
257.70 |
253.35 - 260.80 |
0.3309 times |
Thu 23 October 2025 |
257.70 (2.71%) |
251.90 |
251.90 - 264.70 |
0.6365 times |
Tue 21 October 2025 |
250.90 (1.25%) |
248.70 |
246.30 - 252.00 |
0.2106 times |
Mon 20 October 2025 |
247.80 (1.85%) |
244.55 |
242.80 - 249.00 |
0.3512 times |
Fri 17 October 2025 |
243.30 (0.5%) |
247.80 |
242.00 - 248.10 |
0.4807 times |
Thu 16 October 2025 |
242.10 (1.13%) |
231.90 |
230.25 - 251.00 |
2.5109 times |
Wed 15 October 2025 |
239.40 (-8.42%) |
261.50 |
228.00 - 261.60 |
2.8198 times |
Tue 14 October 2025 |
261.40 (-1.02%) |
264.10 |
259.95 - 269.00 |
0.1151 times |
Mon 13 October 2025 |
264.10 (-1.09%) |
267.00 |
262.40 - 267.50 |
0.0626 times |
Weekly price and charts DB Strong weekly Stock price targets for DB DBCORP are 258 and 283.05 | Weekly Target 1 | 240.47 | | Weekly Target 2 | 250.48 | | Weekly Target 3 | 265.51666666667 | | Weekly Target 4 | 275.53 | | Weekly Target 5 | 290.57 |
Weekly price and volumes for D B
| Date |
Closing |
Open |
Range |
Volume |
Tue 28 October 2025 |
260.50 (0.62%) |
257.90 |
255.50 - 280.55 |
1.5702 times |
Fri 24 October 2025 |
258.90 (6.41%) |
244.55 |
242.80 - 264.70 |
0.9437 times |
Fri 17 October 2025 |
243.30 (-8.88%) |
267.00 |
228.00 - 269.00 |
3.6961 times |
Fri 10 October 2025 |
267.00 (-0.34%) |
270.90 |
253.95 - 271.00 |
0.4043 times |
Fri 03 October 2025 |
267.90 (0.85%) |
266.80 |
264.20 - 273.70 |
0.368 times |
Fri 26 September 2025 |
265.65 (-4.18%) |
278.60 |
260.50 - 278.70 |
0.5985 times |
Fri 19 September 2025 |
277.25 (-2.29%) |
282.85 |
275.40 - 286.00 |
0.379 times |
Fri 12 September 2025 |
283.75 (3.39%) |
276.00 |
267.00 - 287.90 |
1.0914 times |
Fri 05 September 2025 |
274.45 (2.73%) |
267.70 |
265.00 - 279.35 |
0.4438 times |
Fri 29 August 2025 |
267.15 (0.74%) |
266.00 |
259.15 - 269.70 |
0.5049 times |
Fri 22 August 2025 |
265.20 (-1.01%) |
271.35 |
263.25 - 272.05 |
0.4059 times |
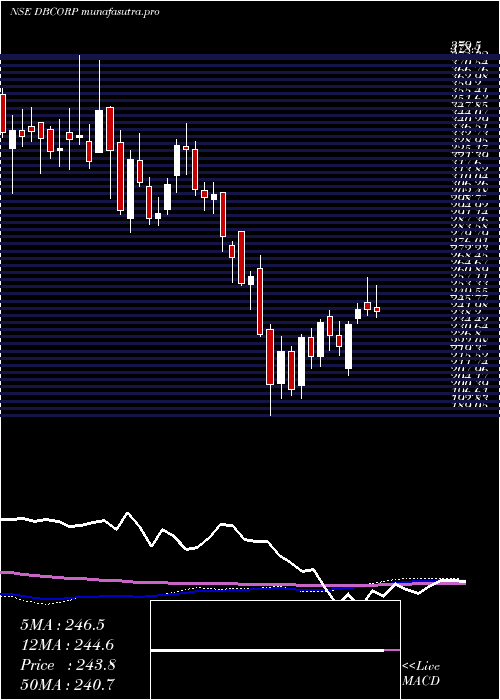
Monthly price and charts DB Strong monthly Stock price targets for DB DBCORP are 217.98 and 270.53 | Monthly Target 1 | 203.8 | | Monthly Target 2 | 232.15 | | Monthly Target 3 | 256.35 | | Monthly Target 4 | 284.7 | | Monthly Target 5 | 308.9 |
Monthly price and volumes D B
| Date |
Closing |
Open |
Range |
Volume |
Tue 28 October 2025 |
260.50 (-3.25%) |
269.25 |
228.00 - 280.55 |
1.185 times |
Tue 30 September 2025 |
269.25 (0.79%) |
267.70 |
260.50 - 287.90 |
0.4844 times |
Fri 29 August 2025 |
267.15 (-0.96%) |
270.00 |
259.15 - 276.20 |
0.3586 times |
Thu 31 July 2025 |
269.75 (-5.23%) |
286.45 |
260.10 - 291.85 |
1.0607 times |
Mon 30 June 2025 |
284.65 (13.45%) |
250.10 |
247.55 - 287.20 |
1.1727 times |
Fri 30 May 2025 |
250.91 (2.92%) |
243.00 |
212.06 - 255.13 |
0.9527 times |
Wed 30 April 2025 |
243.80 (5.36%) |
231.40 |
210.15 - 261.79 |
0.7194 times |
Fri 28 March 2025 |
231.40 (14.07%) |
204.80 |
197.80 - 244.40 |
0.946 times |
Fri 28 February 2025 |
202.85 (-22.69%) |
266.60 |
189.05 - 273.50 |
2.581 times |
Fri 31 January 2025 |
262.40 (-13.16%) |
306.70 |
245.25 - 312.50 |
0.5394 times |
Tue 31 December 2024 |
302.15 (-2.89%) |
315.75 |
296.00 - 343.75 |
0.4396 times |

DMA SMA EMA moving averages of D B DBCORP
DMA (daily moving average) of D B DBCORP
| DMA period | DMA value | | 5 day DMA | 259.52 | | 12 day DMA | 255.23 | | 20 day DMA | 259.79 | | 35 day DMA | 266.52 | | 50 day DMA | 266.86 | | 100 day DMA | 270.13 | | 150 day DMA | 259.97 | | 200 day DMA | 255.26 | EMA (exponential moving average) of D B DBCORP
| EMA period | EMA current | EMA prev | EMA prev2 | | 5 day EMA | 259.77 | 259.41 | 254.32 | | 12 day EMA | 258.2 | 257.78 | 255.63 | | 20 day EMA | 259.91 | 259.85 | 258.82 | | 35 day EMA | 262.65 | 262.78 | 262.38 | | 50 day EMA | 266.54 | 266.79 | 266.68 |
SMA (simple moving average) of D B DBCORP
| SMA period | SMA current | SMA prev | SMA prev2 | | 5 day SMA | 259.52 | 256.98 | 251.72 | | 12 day SMA | 255.23 | 255.58 | 254.9 | | 20 day SMA | 259.79 | 260.05 | 259.79 | | 35 day SMA | 266.52 | 266.91 | 266.95 | | 50 day SMA | 266.86 | 267.1 | 267.13 | | 100 day SMA | 270.13 | 270.17 | 270.02 | | 150 day SMA | 259.97 | 259.77 | 259.45 | | 200 day SMA | 255.26 | 255.42 | 255.6 |
|
|
