DavangereSugar DAVANGERE full analysis,charts,indicators,moving averages,SMA,DMA,EMA,ADX,MACD,RSIDavangere Sugar DAVANGERE WideScreen charts, DMA,SMA,EMA technical analysis, forecast prediction, by indicators ADX,MACD,RSI,CCI NSE stock exchange
Daily price and charts and targets DavangereSugar Strong Daily Stock price targets for DavangereSugar DAVANGERE are 3.91 and 4.26 | Daily Target 1 | 3.64 | | Daily Target 2 | 3.82 | | Daily Target 3 | 3.9866666666667 | | Daily Target 4 | 4.17 | | Daily Target 5 | 4.34 |
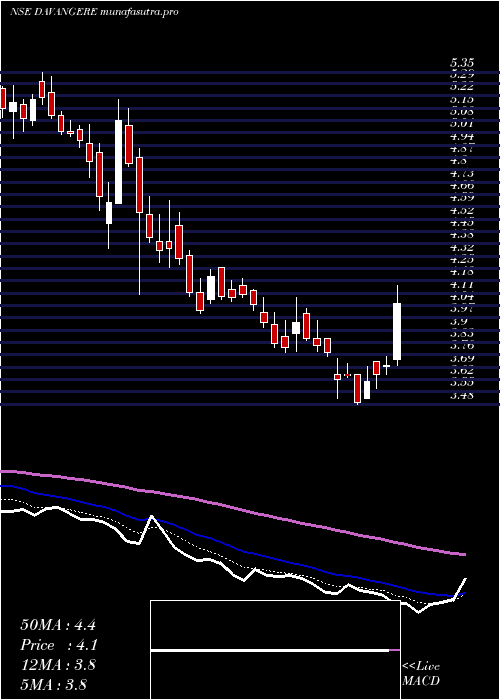
Daily price and volume Davangere Sugar
| Date |
Closing |
Open |
Range |
Volume |
Wed 29 October 2025 |
4.01 (6.37%) |
3.84 |
3.80 - 4.15 |
3.4303 times |
Tue 28 October 2025 |
3.77 (9.91%) |
3.45 |
3.45 - 3.82 |
2.7082 times |
Mon 27 October 2025 |
3.43 (-1.15%) |
3.47 |
3.42 - 3.49 |
0.2889 times |
Fri 24 October 2025 |
3.47 (-0.57%) |
3.49 |
3.45 - 3.52 |
0.2237 times |
Thu 23 October 2025 |
3.49 (0.29%) |
3.52 |
3.47 - 3.53 |
0.323 times |
Tue 21 October 2025 |
3.48 (0.29%) |
3.47 |
3.47 - 3.53 |
0.1139 times |
Mon 20 October 2025 |
3.47 (0%) |
3.57 |
3.40 - 3.57 |
0.2791 times |
Fri 17 October 2025 |
3.47 (-2.25%) |
3.55 |
3.44 - 3.65 |
0.9459 times |
Thu 16 October 2025 |
3.55 (3.8%) |
3.50 |
3.50 - 3.70 |
1.2883 times |
Wed 15 October 2025 |
3.42 (1.18%) |
3.38 |
3.33 - 3.45 |
0.3986 times |
Tue 14 October 2025 |
3.38 (-5.85%) |
3.61 |
3.35 - 3.62 |
1.2671 times |
Weekly price and charts DavangereSugar Strong weekly Stock price targets for DavangereSugar DAVANGERE are 3.72 and 4.45 | Weekly Target 1 | 3.13 | | Weekly Target 2 | 3.57 | | Weekly Target 3 | 3.86 | | Weekly Target 4 | 4.3 | | Weekly Target 5 | 4.59 |
Weekly price and volumes for Davangere Sugar
| Date |
Closing |
Open |
Range |
Volume |
Wed 29 October 2025 |
4.01 (15.56%) |
3.47 |
3.42 - 4.15 |
0.6609 times |
Fri 24 October 2025 |
3.47 (0%) |
3.57 |
3.40 - 3.57 |
0.0966 times |
Fri 17 October 2025 |
3.47 (-5.45%) |
3.67 |
3.33 - 3.70 |
0.5169 times |
Fri 10 October 2025 |
3.67 (-10.71%) |
4.13 |
3.03 - 4.14 |
0.5217 times |
Fri 03 October 2025 |
4.11 (8.16%) |
3.85 |
3.75 - 4.17 |
0.6143 times |
Fri 26 September 2025 |
3.80 (1.33%) |
3.77 |
3.67 - 3.91 |
0.4899 times |
Fri 19 September 2025 |
3.75 (-6.25%) |
4.04 |
3.73 - 4.04 |
1.4151 times |
Fri 12 September 2025 |
4.00 (0.76%) |
4.07 |
3.62 - 4.07 |
0.992 times |
Fri 05 September 2025 |
3.97 (14.08%) |
3.48 |
3.48 - 4.30 |
4.4725 times |
Fri 29 August 2025 |
3.48 (4.5%) |
3.42 |
3.25 - 3.55 |
0.2201 times |
Fri 22 August 2025 |
3.33 (7.42%) |
3.14 |
3.10 - 3.40 |
0.2238 times |

Monthly price and charts DavangereSugar Strong monthly Stock price targets for DavangereSugar DAVANGERE are 3.52 and 4.66 | Monthly Target 1 | 2.6 | | Monthly Target 2 | 3.3 | | Monthly Target 3 | 3.7366666666667 | | Monthly Target 4 | 4.44 | | Monthly Target 5 | 4.88 |
Monthly price and volumes Davangere Sugar
| Date |
Closing |
Open |
Range |
Volume |
Wed 29 October 2025 |
4.01 (6.37%) |
3.79 |
3.03 - 4.17 |
1.4886 times |
Tue 30 September 2025 |
3.77 (8.33%) |
3.48 |
3.48 - 4.30 |
4.7249 times |
Fri 29 August 2025 |
3.48 (5.78%) |
3.39 |
3.06 - 3.55 |
0.3931 times |
Thu 31 July 2025 |
3.29 (-5.19%) |
3.50 |
3.26 - 3.77 |
0.3204 times |
Mon 30 June 2025 |
3.47 (-5.19%) |
3.68 |
3.15 - 3.82 |
0.7381 times |
Fri 30 May 2025 |
3.66 (-2.92%) |
3.81 |
3.60 - 4.13 |
0.3716 times |
Wed 30 April 2025 |
3.77 (-0.79%) |
3.88 |
3.48 - 4.18 |
0.4636 times |
Fri 28 March 2025 |
3.80 (-21.65%) |
4.90 |
3.77 - 5.20 |
0.695 times |
Fri 28 February 2025 |
4.85 (-20.49%) |
5.85 |
4.76 - 5.99 |
0.2707 times |
Fri 31 January 2025 |
6.10 (15.31%) |
5.36 |
4.98 - 6.55 |
0.534 times |
Tue 31 December 2024 |
5.29 (-12.42%) |
6.06 |
5.11 - 6.12 |
0.2865 times |

DMA SMA EMA moving averages of Davangere Sugar DAVANGERE
DMA (daily moving average) of Davangere Sugar DAVANGERE
| DMA period | DMA value | | 5 day DMA | 3.63 | | 12 day DMA | 3.54 | | 20 day DMA | 3.68 | | 35 day DMA | 3.75 | | 50 day DMA | 3.69 | | 100 day DMA | 3.56 | | 150 day DMA | 3.65 | | 200 day DMA | 4.06 | EMA (exponential moving average) of Davangere Sugar DAVANGERE
| EMA period | EMA current | EMA prev | EMA prev2 | | 5 day EMA | 3.71 | 3.56 | 3.46 | | 12 day EMA | 3.64 | 3.57 | 3.53 | | 20 day EMA | 3.65 | 3.61 | 3.59 | | 35 day EMA | 3.63 | 3.61 | 3.6 | | 50 day EMA | 3.64 | 3.62 | 3.61 |
SMA (simple moving average) of Davangere Sugar DAVANGERE
| SMA period | SMA current | SMA prev | SMA prev2 | | 5 day SMA | 3.63 | 3.53 | 3.47 | | 12 day SMA | 3.54 | 3.52 | 3.51 | | 20 day SMA | 3.68 | 3.67 | 3.67 | | 35 day SMA | 3.75 | 3.75 | 3.76 | | 50 day SMA | 3.69 | 3.67 | 3.66 | | 100 day SMA | 3.56 | 3.56 | 3.56 | | 150 day SMA | 3.65 | 3.66 | 3.66 | | 200 day SMA | 4.06 | 4.07 | 4.08 |
|
|
