DamodarIndust DAMODARIND full analysis,charts,indicators,moving averages,SMA,DMA,EMA,ADX,MACD,RSIDamodar Indust DAMODARIND WideScreen charts, DMA,SMA,EMA technical analysis, forecast prediction, by indicators ADX,MACD,RSI,CCI NSE stock exchange
operates under Textiles sector
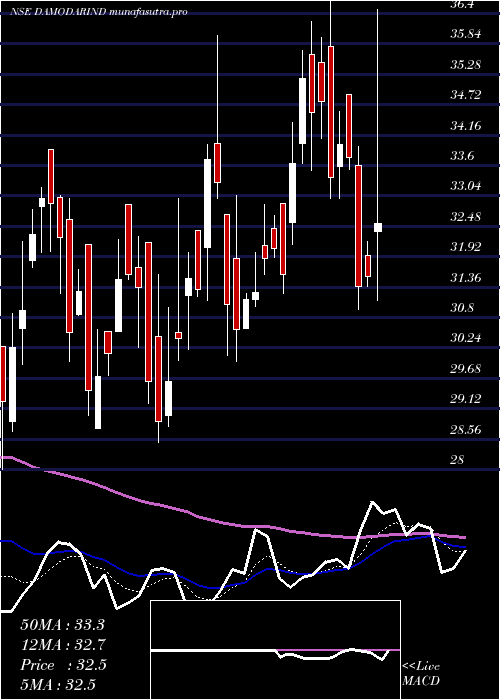
Daily price and charts and targets DamodarIndust Strong Daily Stock price targets for DamodarIndust DAMODARIND are 33.94 and 35.19 | Daily Target 1 | 33.59 | | Daily Target 2 | 34.28 | | Daily Target 3 | 34.84 | | Daily Target 4 | 35.53 | | Daily Target 5 | 36.09 |
Daily price and volume Damodar Indust
| Date |
Closing |
Open |
Range |
Volume |
Tue 28 October 2025 |
34.97 (0.09%) |
35.40 |
34.15 - 35.40 |
0.2413 times |
Mon 27 October 2025 |
34.94 (-3.37%) |
35.51 |
34.62 - 36.13 |
1.0288 times |
Fri 24 October 2025 |
36.16 (-0.06%) |
36.69 |
35.21 - 36.69 |
0.6355 times |
Thu 23 October 2025 |
36.18 (3.55%) |
35.99 |
35.11 - 37.20 |
2.3617 times |
Tue 21 October 2025 |
34.94 (-1.61%) |
35.50 |
34.61 - 35.50 |
0.1554 times |
Mon 20 October 2025 |
35.51 (2.9%) |
35.50 |
34.51 - 35.75 |
0.7166 times |
Fri 17 October 2025 |
34.51 (3.01%) |
34.49 |
33.99 - 34.99 |
2.4029 times |
Thu 16 October 2025 |
33.50 (-0.65%) |
33.99 |
33.32 - 34.00 |
1.0449 times |
Wed 15 October 2025 |
33.72 (0%) |
33.99 |
33.20 - 33.99 |
0.6176 times |
Tue 14 October 2025 |
33.72 (0.57%) |
33.92 |
33.34 - 34.00 |
0.7952 times |
Mon 13 October 2025 |
33.53 (-0.86%) |
33.99 |
32.30 - 34.00 |
1.0429 times |
Weekly price and charts DamodarIndust Strong weekly Stock price targets for DamodarIndust DAMODARIND are 33.57 and 35.55 | Weekly Target 1 | 33.1 | | Weekly Target 2 | 34.04 | | Weekly Target 3 | 35.083333333333 | | Weekly Target 4 | 36.02 | | Weekly Target 5 | 37.06 |
Weekly price and volumes for Damodar Indust
| Date |
Closing |
Open |
Range |
Volume |
Tue 28 October 2025 |
34.97 (-3.29%) |
35.51 |
34.15 - 36.13 |
0.2577 times |
Fri 24 October 2025 |
36.16 (4.78%) |
35.50 |
34.51 - 37.20 |
0.785 times |
Fri 17 October 2025 |
34.51 (2.04%) |
33.99 |
32.30 - 34.99 |
1.1977 times |
Fri 10 October 2025 |
33.82 (-0.47%) |
35.00 |
32.00 - 35.00 |
0.9944 times |
Fri 03 October 2025 |
33.98 (-2.89%) |
35.17 |
33.20 - 35.90 |
0.3681 times |
Fri 26 September 2025 |
34.99 (-4.89%) |
36.10 |
34.61 - 38.00 |
1.7479 times |
Fri 19 September 2025 |
36.79 (5.93%) |
34.90 |
34.20 - 38.80 |
1.4863 times |
Fri 12 September 2025 |
34.73 (-1.34%) |
36.25 |
34.00 - 36.99 |
1.1469 times |
Fri 05 September 2025 |
35.20 (-2.52%) |
36.27 |
34.30 - 37.50 |
1.0998 times |
Fri 29 August 2025 |
36.11 (0.56%) |
36.96 |
35.11 - 38.79 |
0.9161 times |
Fri 22 August 2025 |
35.91 (-0.19%) |
36.26 |
35.10 - 39.00 |
2.667 times |
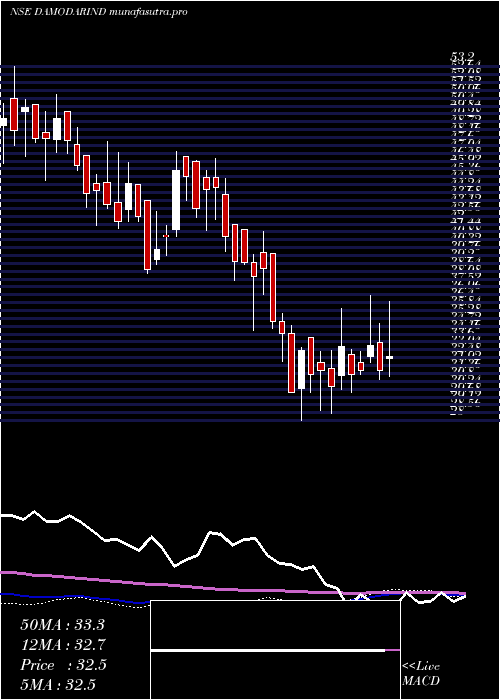
Monthly price and charts DamodarIndust Strong monthly Stock price targets for DamodarIndust DAMODARIND are 30.89 and 36.09 | Monthly Target 1 | 29.52 | | Monthly Target 2 | 32.25 | | Monthly Target 3 | 34.723333333333 | | Monthly Target 4 | 37.45 | | Monthly Target 5 | 39.92 |
Monthly price and volumes Damodar Indust
| Date |
Closing |
Open |
Range |
Volume |
Tue 28 October 2025 |
34.97 (-0.37%) |
35.49 |
32.00 - 37.20 |
0.5382 times |
Tue 30 September 2025 |
35.10 (-2.8%) |
36.27 |
34.00 - 38.80 |
0.8384 times |
Fri 29 August 2025 |
36.11 (-0.55%) |
36.00 |
34.00 - 39.00 |
0.7263 times |
Thu 31 July 2025 |
36.31 (0.86%) |
36.56 |
35.81 - 41.49 |
1.3945 times |
Mon 30 June 2025 |
36.00 (-5.98%) |
39.45 |
34.50 - 39.45 |
0.5725 times |
Fri 30 May 2025 |
38.29 (22.06%) |
31.95 |
29.30 - 40.40 |
1.5544 times |
Wed 30 April 2025 |
31.37 (3.16%) |
31.20 |
30.00 - 36.90 |
1.0078 times |
Fri 28 March 2025 |
30.41 (1.27%) |
30.27 |
28.00 - 33.89 |
1.7956 times |
Fri 28 February 2025 |
30.03 (-21.47%) |
39.95 |
30.00 - 41.45 |
0.6481 times |
Fri 31 January 2025 |
38.24 (-10.59%) |
44.79 |
34.40 - 46.70 |
0.9243 times |
Tue 31 December 2024 |
42.77 (4.06%) |
41.60 |
41.12 - 47.15 |
1.6881 times |

DMA SMA EMA moving averages of Damodar Indust DAMODARIND
DMA (daily moving average) of Damodar Indust DAMODARIND
| DMA period | DMA value | | 5 day DMA | 35.44 | | 12 day DMA | 34.63 | | 20 day DMA | 34.32 | | 35 day DMA | 34.87 | | 50 day DMA | 35.18 | | 100 day DMA | 36.1 | | 150 day DMA | 35.21 | | 200 day DMA | 35.38 | EMA (exponential moving average) of Damodar Indust DAMODARIND
| EMA period | EMA current | EMA prev | EMA prev2 | | 5 day EMA | 35.18 | 35.29 | 35.47 | | 12 day EMA | 34.88 | 34.86 | 34.84 | | 20 day EMA | 34.78 | 34.76 | 34.74 | | 35 day EMA | 34.89 | 34.89 | 34.89 | | 50 day EMA | 35.27 | 35.28 | 35.29 |
SMA (simple moving average) of Damodar Indust DAMODARIND
| SMA period | SMA current | SMA prev | SMA prev2 | | 5 day SMA | 35.44 | 35.55 | 35.46 | | 12 day SMA | 34.63 | 34.45 | 34.27 | | 20 day SMA | 34.32 | 34.32 | 34.38 | | 35 day SMA | 34.87 | 34.87 | 34.88 | | 50 day SMA | 35.18 | 35.18 | 35.21 | | 100 day SMA | 36.1 | 36.13 | 36.15 | | 150 day SMA | 35.21 | 35.17 | 35.14 | | 200 day SMA | 35.38 | 35.41 | 35.46 |
|
|
