CurrentInfraprojects CURRENT_SM full analysis,charts,indicators,moving averages,SMA,DMA,EMA,ADX,MACD,RSICurrent Infraprojects CURRENT_SM WideScreen charts, DMA,SMA,EMA technical analysis, forecast prediction, by indicators ADX,MACD,RSI,CCI NSE stock exchange
Daily price and charts and targets CurrentInfraprojects Strong Daily Stock price targets for CurrentInfraprojects CURRENT_SM are 144.9 and 148.25 | Daily Target 1 | 142.12 | | Daily Target 2 | 144.33 | | Daily Target 3 | 145.46666666667 | | Daily Target 4 | 147.68 | | Daily Target 5 | 148.82 |
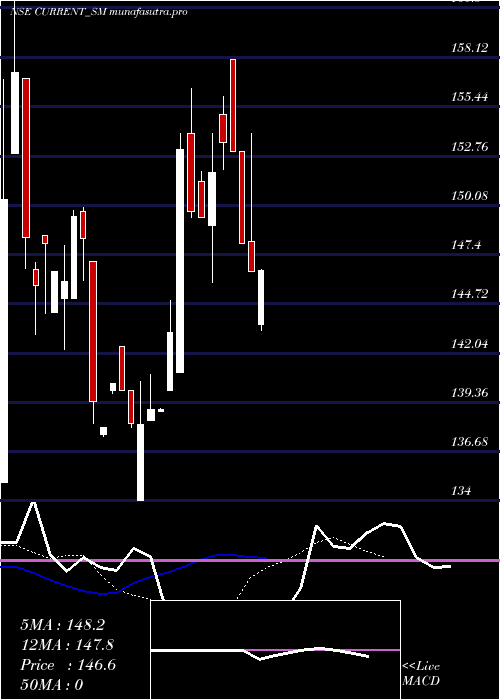
Daily price and volume Current Infraprojects
| Date |
Closing |
Open |
Range |
Volume |
Tue 28 October 2025 |
146.55 (0.03%) |
143.60 |
143.25 - 146.60 |
0.1908 times |
Mon 27 October 2025 |
146.50 (-1.01%) |
148.10 |
146.50 - 154.00 |
0.3975 times |
Fri 24 October 2025 |
148.00 (-3.27%) |
153.00 |
148.00 - 153.00 |
0.0636 times |
Thu 23 October 2025 |
153.00 (-0.33%) |
158.00 |
153.00 - 158.00 |
0.3021 times |
Mon 20 October 2025 |
153.50 (1.09%) |
155.00 |
152.00 - 156.00 |
1.0334 times |
Fri 17 October 2025 |
151.85 (1.64%) |
149.00 |
145.90 - 154.00 |
2.3052 times |
Thu 16 October 2025 |
149.40 (-0.23%) |
151.40 |
149.40 - 151.90 |
0.8108 times |
Wed 15 October 2025 |
149.75 (-2.19%) |
154.00 |
149.40 - 156.40 |
1.4149 times |
Tue 14 October 2025 |
153.10 (6.95%) |
141.00 |
141.00 - 154.00 |
3.0366 times |
Mon 13 October 2025 |
143.15 (2.99%) |
140.00 |
140.00 - 144.90 |
0.4452 times |
Fri 10 October 2025 |
139.00 (0.04%) |
138.90 |
138.90 - 139.05 |
0.0954 times |
Weekly price and charts CurrentInfraprojects Strong weekly Stock price targets for CurrentInfraprojects CURRENT_SM are 139.53 and 150.28 | Weekly Target 1 | 137.18 | | Weekly Target 2 | 141.87 | | Weekly Target 3 | 147.93333333333 | | Weekly Target 4 | 152.62 | | Weekly Target 5 | 158.68 |
Weekly price and volumes for Current Infraprojects
| Date |
Closing |
Open |
Range |
Volume |
Tue 28 October 2025 |
146.55 (-0.98%) |
148.10 |
143.25 - 154.00 |
0.2116 times |
Fri 24 October 2025 |
148.00 (-2.54%) |
155.00 |
148.00 - 158.00 |
0.5033 times |
Fri 17 October 2025 |
151.85 (9.24%) |
140.00 |
140.00 - 156.40 |
2.8827 times |
Fri 10 October 2025 |
139.00 (-1%) |
142.40 |
134.00 - 142.40 |
0.8008 times |
Fri 03 October 2025 |
140.40 (-6.06%) |
149.75 |
137.50 - 149.95 |
0.9266 times |
Fri 26 September 2025 |
149.45 (0%) |
146.60 |
142.25 - 149.80 |
0.6749 times |
Wed 29 October 2025 |
(0%) |
|
- |
0 times |

Monthly price and charts CurrentInfraprojects Strong monthly Stock price targets for CurrentInfraprojects CURRENT_SM are 140.28 and 164.28 | Monthly Target 1 | 122.18 | | Monthly Target 2 | 134.37 | | Monthly Target 3 | 146.18333333333 | | Monthly Target 4 | 158.37 | | Monthly Target 5 | 170.18 |
Monthly price and volumes Current Infraprojects
| Date |
Closing |
Open |
Range |
Volume |
Tue 28 October 2025 |
146.55 (5.13%) |
137.60 |
134.00 - 158.00 |
1.0323 times |
Tue 30 September 2025 |
139.40 (0%) |
135.00 |
135.00 - 163.00 |
0.9677 times |
Wed 29 October 2025 |
(0%) |
|
- |
0 times |

DMA SMA EMA moving averages of Current Infraprojects CURRENT_SM
DMA (daily moving average) of Current Infraprojects CURRENT_SM
| DMA period | DMA value | | 5 day DMA | 149.51 | | 12 day DMA | 147.73 | | 20 day DMA | 145.23 | | 35 day DMA | | | 50 day DMA | | | 100 day DMA | | | 150 day DMA | | | 200 day DMA | | EMA (exponential moving average) of Current Infraprojects CURRENT_SM
| EMA period | EMA current | EMA prev | EMA prev2 | | 5 day EMA | 148.16 | 148.96 | 150.19 | | 12 day EMA | 147.84 | 148.07 | 148.36 | | 20 day EMA | 147.19 | 147.26 | 147.34 | | 35 day EMA | 0 | 0 | 0 | | 50 day EMA | 0 | 0 | 0 |
SMA (simple moving average) of Current Infraprojects CURRENT_SM
| SMA period | SMA current | SMA prev | SMA prev2 | | 5 day SMA | 149.51 | 150.57 | 151.15 | | 12 day SMA | 147.73 | 147.03 | 146.34 | | 20 day SMA | 145.23 | 145.2 | 145.2 | | 35 day SMA | | 50 day SMA | | 100 day SMA | | 150 day SMA | | 200 day SMA |
|
|
