CuraTechnologies CURAA_BE full analysis,charts,indicators,moving averages,SMA,DMA,EMA,ADX,MACD,RSICura Technologies CURAA_BE WideScreen charts, DMA,SMA,EMA technical analysis, forecast prediction, by indicators ADX,MACD,RSI,CCI NSE stock exchange
Daily price and charts and targets CuraTechnologies Strong Daily Stock price targets for CuraTechnologies CURAA_BE are 150.85 and 150.85 | Daily Target 1 | 150.85 | | Daily Target 2 | 150.85 | | Daily Target 3 | 150.85 | | Daily Target 4 | 150.85 | | Daily Target 5 | 150.85 |
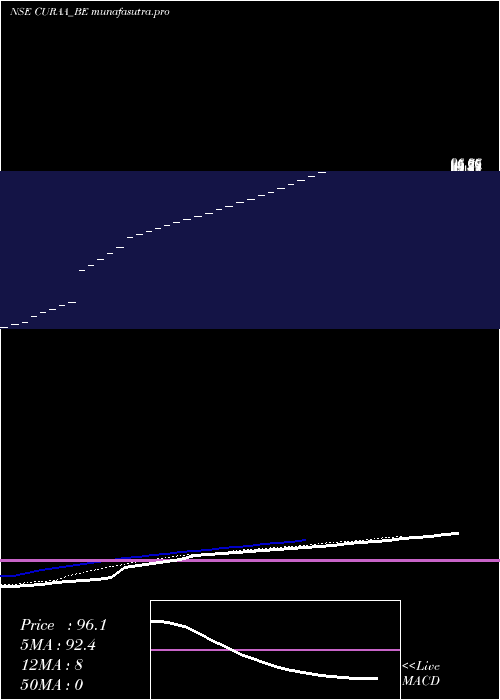
Daily price and volume Cura Technologies
| Date |
Closing |
Open |
Range |
Volume |
Tue 28 October 2025 |
150.85 (-2%) |
150.85 |
150.85 - 150.85 |
0.9203 times |
Mon 27 October 2025 |
153.93 (-2.01%) |
153.93 |
153.93 - 153.93 |
0.6033 times |
Fri 24 October 2025 |
157.08 (-2%) |
157.08 |
157.08 - 157.08 |
1.2034 times |
Thu 23 October 2025 |
160.29 (-2.01%) |
160.29 |
160.29 - 160.29 |
1.1173 times |
Tue 21 October 2025 |
163.57 (-2%) |
163.57 |
163.57 - 163.57 |
0.0185 times |
Mon 20 October 2025 |
166.91 (-2%) |
166.91 |
166.91 - 166.91 |
0.6925 times |
Fri 17 October 2025 |
170.32 (-2%) |
170.32 |
170.32 - 170.32 |
0.7633 times |
Thu 16 October 2025 |
173.80 (-2%) |
173.80 |
173.80 - 173.80 |
0.9449 times |
Wed 15 October 2025 |
177.35 (-2%) |
177.35 |
177.35 - 177.35 |
1.6836 times |
Tue 14 October 2025 |
180.97 (-2%) |
180.97 |
180.97 - 180.97 |
2.0529 times |
Mon 13 October 2025 |
184.67 (-2%) |
184.70 |
184.67 - 184.70 |
0.434 times |
Weekly price and charts CuraTechnologies Strong weekly Stock price targets for CuraTechnologies CURAA_BE are 149.31 and 152.39 | Weekly Target 1 | 148.8 | | Weekly Target 2 | 149.82 | | Weekly Target 3 | 151.87666666667 | | Weekly Target 4 | 152.9 | | Weekly Target 5 | 154.96 |
Weekly price and volumes for Cura Technologies
| Date |
Closing |
Open |
Range |
Volume |
Tue 28 October 2025 |
150.85 (-3.97%) |
153.93 |
150.85 - 153.93 |
0.1993 times |
Fri 24 October 2025 |
157.08 (-7.77%) |
166.91 |
157.08 - 166.91 |
0.3965 times |
Fri 17 October 2025 |
170.32 (-9.62%) |
184.70 |
170.32 - 184.70 |
0.7689 times |
Fri 10 October 2025 |
188.44 (-9.62%) |
204.32 |
188.44 - 204.32 |
0.1598 times |
Fri 03 October 2025 |
208.49 (-7.75%) |
221.50 |
208.49 - 221.50 |
0.9492 times |
Fri 26 September 2025 |
226.00 (19.07%) |
199.25 |
199.25 - 235.20 |
1.1163 times |
Fri 19 September 2025 |
189.80 (-14.49%) |
210.85 |
171.80 - 210.85 |
3.1475 times |
Fri 12 September 2025 |
221.95 (-22.6%) |
272.45 |
221.95 - 272.45 |
0.533 times |
Fri 05 September 2025 |
286.75 (-9.59%) |
310.85 |
286.75 - 310.85 |
0.1763 times |
Fri 29 August 2025 |
317.17 (-4.98%) |
335.11 |
317.17 - 337.00 |
2.5533 times |
Fri 22 August 2025 |
333.79 (10.4%) |
308.39 |
308.39 - 333.79 |
3.8141 times |

Monthly price and charts CuraTechnologies Strong monthly Stock price targets for CuraTechnologies CURAA_BE are 119.88 and 181.83 | Monthly Target 1 | 109.55 | | Monthly Target 2 | 130.2 | | Monthly Target 3 | 171.5 | | Monthly Target 4 | 192.15 | | Monthly Target 5 | 233.45 |
Monthly price and volumes Cura Technologies
| Date |
Closing |
Open |
Range |
Volume |
Tue 28 October 2025 |
150.85 (-30.52%) |
212.80 |
150.85 - 212.80 |
0.8067 times |
Tue 30 September 2025 |
217.10 (-31.55%) |
310.85 |
171.80 - 310.85 |
1.7972 times |
Fri 29 August 2025 |
317.17 (27.83%) |
253.07 |
248.11 - 337.00 |
2.9049 times |
Thu 31 July 2025 |
248.11 (57.6%) |
160.57 |
160.57 - 248.11 |
1.6973 times |
Mon 30 June 2025 |
157.43 (51.45%) |
106.02 |
106.02 - 157.43 |
0.237 times |
Fri 30 May 2025 |
103.95 (45.51%) |
72.86 |
72.86 - 103.95 |
0.4765 times |
Wed 30 April 2025 |
71.44 (138.93%) |
31.39 |
31.39 - 71.44 |
0.0443 times |
Fri 28 March 2025 |
29.90 (0%) |
24.43 |
24.43 - 29.90 |
0.036 times |
Wed 29 October 2025 |
(0%) |
|
- |
0 times |

DMA SMA EMA moving averages of Cura Technologies CURAA_BE
DMA (daily moving average) of Cura Technologies CURAA_BE
| DMA period | DMA value | | 5 day DMA | 157.14 | | 12 day DMA | 169.02 | | 20 day DMA | 184.05 | | 35 day DMA | 199.16 | | 50 day DMA | 233.58 | | 100 day DMA | 211.86 | | 150 day DMA | | | 200 day DMA | | EMA (exponential moving average) of Cura Technologies CURAA_BE
| EMA period | EMA current | EMA prev | EMA prev2 | | 5 day EMA | 157.27 | 160.48 | 163.76 | | 12 day EMA | 168.81 | 172.07 | 175.37 | | 20 day EMA | 181.15 | 184.34 | 187.54 | | 35 day EMA | 206.52 | 209.8 | 213.09 | | 50 day EMA | 230.15 | 233.39 | 236.63 |
SMA (simple moving average) of Cura Technologies CURAA_BE
| SMA period | SMA current | SMA prev | SMA prev2 | | 5 day SMA | 157.14 | 160.36 | 163.63 | | 12 day SMA | 169.02 | 172.47 | 175.99 | | 20 day SMA | 184.05 | 187.81 | 191.65 | | 35 day SMA | 199.16 | 203.04 | 207 | | 50 day SMA | 233.58 | 236.5 | 239.23 | | 100 day SMA | 211.86 | 211.45 | 211 | | 150 day SMA | | 200 day SMA |
|
|
