CslFinance CSLFINANCE full analysis,charts,indicators,moving averages,SMA,DMA,EMA,ADX,MACD,RSICsl Finance CSLFINANCE WideScreen charts, DMA,SMA,EMA technical analysis, forecast prediction, by indicators ADX,MACD,RSI,CCI NSE stock exchange
Daily price and charts and targets CslFinance Strong Daily Stock price targets for CslFinance CSLFINANCE are 279.08 and 288.28 | Daily Target 1 | 271.78 | | Daily Target 2 | 277.17 | | Daily Target 3 | 280.98333333333 | | Daily Target 4 | 286.37 | | Daily Target 5 | 290.18 |
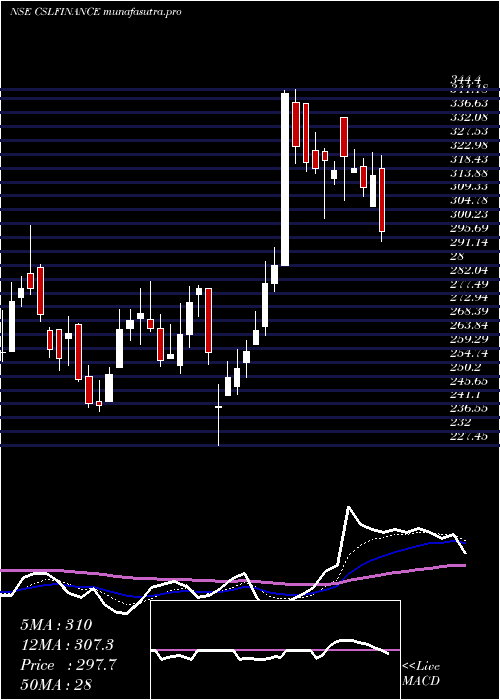
Daily price and volume Csl Finance
| Date |
Closing |
Open |
Range |
Volume |
Tue 28 October 2025 |
282.55 (1.84%) |
278.55 |
275.60 - 284.80 |
1.0833 times |
Mon 27 October 2025 |
277.45 (-0.2%) |
283.55 |
270.90 - 285.00 |
1.1013 times |
Fri 24 October 2025 |
278.00 (-1.07%) |
280.20 |
276.10 - 281.95 |
0.789 times |
Thu 23 October 2025 |
281.00 (0.63%) |
280.60 |
278.50 - 283.55 |
0.6602 times |
Tue 21 October 2025 |
279.25 (1.82%) |
274.00 |
272.00 - 283.40 |
0.359 times |
Mon 20 October 2025 |
274.25 (1.52%) |
265.25 |
265.25 - 279.00 |
0.7382 times |
Fri 17 October 2025 |
270.15 (-1.8%) |
280.65 |
264.55 - 280.65 |
1.3407 times |
Thu 16 October 2025 |
275.10 (-0.09%) |
280.00 |
273.00 - 284.45 |
0.7072 times |
Wed 15 October 2025 |
275.35 (-1.99%) |
288.00 |
268.70 - 288.00 |
2.8372 times |
Tue 14 October 2025 |
280.95 (0.21%) |
281.00 |
280.00 - 284.70 |
0.3837 times |
Mon 13 October 2025 |
280.35 (-1.75%) |
281.00 |
279.00 - 288.95 |
1.3323 times |
Weekly price and charts CslFinance Strong weekly Stock price targets for CslFinance CSLFINANCE are 269.68 and 283.78 | Weekly Target 1 | 265.38 | | Weekly Target 2 | 273.97 | | Weekly Target 3 | 279.48333333333 | | Weekly Target 4 | 288.07 | | Weekly Target 5 | 293.58 |
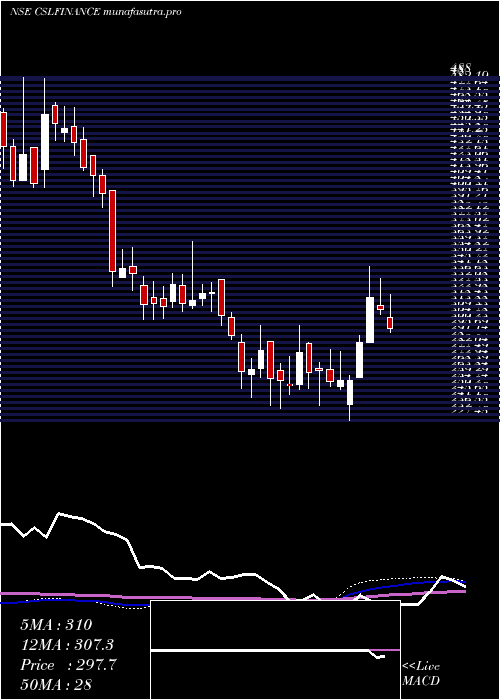
Weekly price and volumes for Csl Finance
| Date |
Closing |
Open |
Range |
Volume |
Tue 28 October 2025 |
282.55 (1.64%) |
283.55 |
270.90 - 285.00 |
0.4065 times |
Fri 24 October 2025 |
278.00 (2.91%) |
265.25 |
265.25 - 283.55 |
0.4739 times |
Fri 17 October 2025 |
270.15 (-5.33%) |
281.00 |
264.55 - 288.95 |
1.2284 times |
Fri 10 October 2025 |
285.35 (-0.78%) |
286.00 |
281.00 - 294.70 |
0.6883 times |
Fri 03 October 2025 |
287.60 (3.27%) |
284.90 |
275.90 - 296.00 |
0.5268 times |
Fri 26 September 2025 |
278.50 (-7.35%) |
300.00 |
276.10 - 302.90 |
0.8933 times |
Fri 19 September 2025 |
300.60 (2.45%) |
297.00 |
290.10 - 307.70 |
2.1342 times |
Fri 12 September 2025 |
293.40 (0.34%) |
291.45 |
287.85 - 304.05 |
1.5517 times |
Fri 05 September 2025 |
292.40 (-2.32%) |
302.00 |
286.60 - 304.50 |
1.2679 times |
Fri 29 August 2025 |
299.35 (-3.12%) |
306.00 |
284.05 - 314.85 |
0.8291 times |
Fri 22 August 2025 |
309.00 (1.64%) |
304.00 |
300.05 - 313.95 |
0.696 times |
Monthly price and charts CslFinance Strong monthly Stock price targets for CslFinance CSLFINANCE are 257.83 and 289.28 | Monthly Target 1 | 249.58 | | Monthly Target 2 | 266.07 | | Monthly Target 3 | 281.03333333333 | | Monthly Target 4 | 297.52 | | Monthly Target 5 | 312.48 |
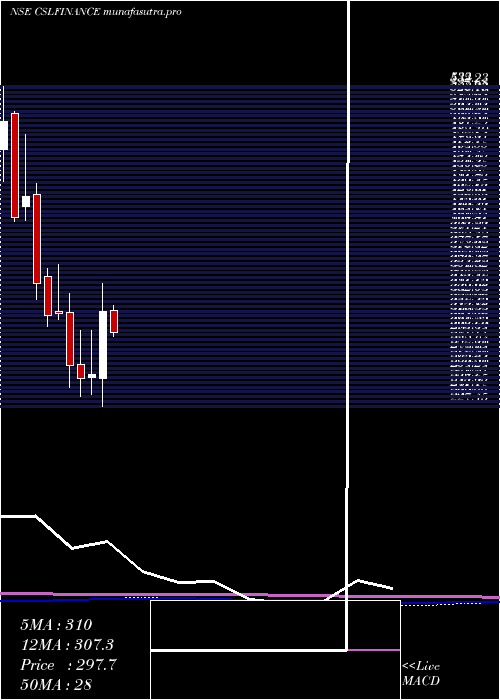
Monthly price and volumes Csl Finance
| Date |
Closing |
Open |
Range |
Volume |
Tue 28 October 2025 |
282.55 (-1.79%) |
290.40 |
264.55 - 296.00 |
0.2552 times |
Tue 30 September 2025 |
287.70 (-3.89%) |
302.00 |
275.90 - 307.70 |
0.4777 times |
Fri 29 August 2025 |
299.35 (-1.93%) |
308.95 |
284.05 - 322.80 |
0.2866 times |
Thu 31 July 2025 |
305.25 (-9.52%) |
334.00 |
295.75 - 349.00 |
0.57 times |
Mon 30 June 2025 |
337.35 (5.14%) |
324.05 |
317.50 - 380.20 |
0.9234 times |
Fri 30 May 2025 |
320.85 (0.8%) |
319.05 |
273.00 - 328.20 |
0.6035 times |
Wed 30 April 2025 |
318.30 (23.64%) |
253.60 |
227.45 - 344.40 |
2.3979 times |
Fri 28 March 2025 |
257.45 (1.26%) |
254.90 |
238.60 - 299.50 |
2.1679 times |
Fri 28 February 2025 |
254.25 (-4.47%) |
267.15 |
236.60 - 300.00 |
0.8773 times |
Fri 31 January 2025 |
266.15 (-15.72%) |
317.00 |
245.00 - 334.90 |
1.4405 times |
Tue 31 December 2024 |
315.80 (0.46%) |
318.00 |
310.00 - 363.25 |
1.2175 times |
DMA SMA EMA moving averages of Csl Finance CSLFINANCE
DMA (daily moving average) of Csl Finance CSLFINANCE
| DMA period | DMA value | | 5 day DMA | 279.65 | | 12 day DMA | 278.31 | | 20 day DMA | 281 | | 35 day DMA | 286.28 | | 50 day DMA | 290.39 | | 100 day DMA | 307.19 | | 150 day DMA | 303.91 | | 200 day DMA | 295.67 | EMA (exponential moving average) of Csl Finance CSLFINANCE
| EMA period | EMA current | EMA prev | EMA prev2 | | 5 day EMA | 279.4 | 277.83 | 278.02 | | 12 day EMA | 279.56 | 279.02 | 279.3 | | 20 day EMA | 281.53 | 281.42 | 281.84 | | 35 day EMA | 285.67 | 285.85 | 286.34 | | 50 day EMA | 290.36 | 290.68 | 291.22 |
SMA (simple moving average) of Csl Finance CSLFINANCE
| SMA period | SMA current | SMA prev | SMA prev2 | | 5 day SMA | 279.65 | 277.99 | 276.53 | | 12 day SMA | 278.31 | 278.33 | 278.8 | | 20 day SMA | 281 | 280.8 | 281.29 | | 35 day SMA | 286.28 | 286.56 | 287.01 | | 50 day SMA | 290.39 | 290.96 | 291.59 | | 100 day SMA | 307.19 | 307.67 | 308.25 | | 150 day SMA | 303.91 | 303.63 | 303.39 | | 200 day SMA | 295.67 | 295.85 | 296.08 |
|
|
