CrestVentures CREST full analysis,charts,indicators,moving averages,SMA,DMA,EMA,ADX,MACD,RSICrest Ventures CREST WideScreen charts, DMA,SMA,EMA technical analysis, forecast prediction, by indicators ADX,MACD,RSI,CCI NSE stock exchange
operates under Misc.Commercial Services sector
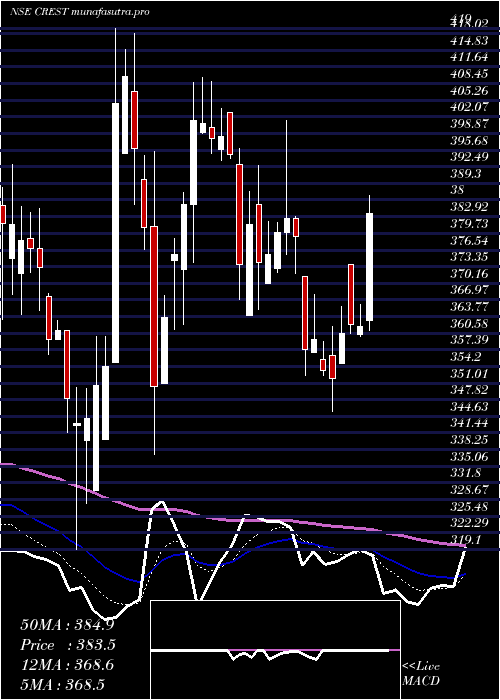
Daily price and charts and targets CrestVentures Strong Daily Stock price targets for CrestVentures CREST are 369.73 and 379.43 | Daily Target 1 | 367.35 | | Daily Target 2 | 372.1 | | Daily Target 3 | 377.05 | | Daily Target 4 | 381.8 | | Daily Target 5 | 386.75 |
Daily price and volume Crest Ventures
| Date |
Closing |
Open |
Range |
Volume |
Thu 30 October 2025 |
376.85 (-0.04%) |
377.55 |
372.30 - 382.00 |
2.4173 times |
Wed 29 October 2025 |
377.00 (-1.8%) |
386.35 |
372.00 - 387.95 |
1.8685 times |
Tue 28 October 2025 |
383.90 (-2.74%) |
395.95 |
382.05 - 395.95 |
0.5272 times |
Mon 27 October 2025 |
394.70 (0%) |
395.00 |
385.95 - 398.95 |
1.9726 times |
Fri 24 October 2025 |
394.70 (2.68%) |
387.95 |
378.05 - 399.00 |
0.6406 times |
Thu 23 October 2025 |
384.40 (3.35%) |
385.00 |
374.90 - 385.00 |
1.1093 times |
Tue 21 October 2025 |
371.95 (4.58%) |
359.95 |
359.95 - 375.00 |
0.3182 times |
Mon 20 October 2025 |
355.65 (1.21%) |
343.40 |
343.40 - 358.40 |
0.1518 times |
Fri 17 October 2025 |
351.40 (0.07%) |
353.25 |
343.00 - 354.00 |
0.8798 times |
Thu 16 October 2025 |
351.15 (1.77%) |
350.20 |
345.90 - 354.95 |
0.1147 times |
Wed 15 October 2025 |
345.05 (-0.86%) |
348.05 |
342.00 - 354.00 |
0.3214 times |
Weekly price and charts CrestVentures Strong weekly Stock price targets for CrestVentures CREST are 360.95 and 387.9 | Weekly Target 1 | 355.65 | | Weekly Target 2 | 366.25 | | Weekly Target 3 | 382.6 | | Weekly Target 4 | 393.2 | | Weekly Target 5 | 409.55 |
Weekly price and volumes for Crest Ventures
| Date |
Closing |
Open |
Range |
Volume |
Thu 30 October 2025 |
376.85 (-4.52%) |
395.00 |
372.00 - 398.95 |
2.3631 times |
Fri 24 October 2025 |
394.70 (12.32%) |
343.40 |
343.40 - 399.00 |
0.7731 times |
Fri 17 October 2025 |
351.40 (-3.38%) |
356.20 |
342.00 - 364.40 |
0.8662 times |
Fri 10 October 2025 |
363.70 (2.61%) |
355.05 |
343.00 - 370.00 |
0.7673 times |
Fri 03 October 2025 |
354.45 (-2.11%) |
362.10 |
346.95 - 369.00 |
0.7688 times |
Fri 26 September 2025 |
362.10 (-4.86%) |
370.20 |
361.50 - 381.75 |
0.4658 times |
Fri 19 September 2025 |
380.60 (0.97%) |
375.55 |
370.60 - 395.00 |
0.9974 times |
Fri 12 September 2025 |
376.95 (0.04%) |
373.90 |
373.00 - 386.50 |
0.616 times |
Fri 05 September 2025 |
376.80 (1.69%) |
369.00 |
357.70 - 399.00 |
1.4634 times |
Fri 29 August 2025 |
370.55 (-1.15%) |
379.45 |
356.55 - 380.05 |
0.9188 times |
Fri 22 August 2025 |
374.85 (0.68%) |
373.80 |
373.00 - 389.10 |
1.2732 times |

Monthly price and charts CrestVentures Strong monthly Stock price targets for CrestVentures CREST are 359.43 and 416.43 | Monthly Target 1 | 315.62 | | Monthly Target 2 | 346.23 | | Monthly Target 3 | 372.61666666667 | | Monthly Target 4 | 403.23 | | Monthly Target 5 | 429.62 |
Monthly price and volumes Crest Ventures
| Date |
Closing |
Open |
Range |
Volume |
Thu 30 October 2025 |
376.85 (4.16%) |
366.65 |
342.00 - 399.00 |
0.5114 times |
Tue 30 September 2025 |
361.80 (-2.36%) |
369.00 |
346.95 - 399.00 |
0.3993 times |
Fri 29 August 2025 |
370.55 (-0.01%) |
370.00 |
356.55 - 390.95 |
0.3528 times |
Thu 31 July 2025 |
370.60 (-4.69%) |
384.95 |
368.35 - 405.00 |
0.7245 times |
Mon 30 June 2025 |
388.85 (-2.93%) |
386.05 |
385.00 - 430.10 |
1.6043 times |
Fri 30 May 2025 |
400.60 (2.04%) |
392.60 |
350.90 - 424.40 |
0.6506 times |
Wed 30 April 2025 |
392.60 (4.96%) |
370.00 |
345.50 - 412.35 |
0.958 times |
Fri 28 March 2025 |
374.05 (8.96%) |
340.05 |
328.00 - 419.00 |
2.5795 times |
Fri 28 February 2025 |
343.30 (-19.11%) |
417.35 |
319.10 - 428.45 |
0.9377 times |
Fri 31 January 2025 |
424.40 (-0.41%) |
428.40 |
390.35 - 487.95 |
1.2821 times |
Tue 31 December 2024 |
426.15 (-13.16%) |
492.90 |
412.10 - 510.75 |
2.2232 times |

DMA SMA EMA moving averages of Crest Ventures CREST
DMA (daily moving average) of Crest Ventures CREST
| DMA period | DMA value | | 5 day DMA | 385.43 | | 12 day DMA | 369.57 | | 20 day DMA | 363.74 | | 35 day DMA | 368.67 | | 50 day DMA | 371.05 | | 100 day DMA | 379.74 | | 150 day DMA | 382.99 | | 200 day DMA | 387.03 | EMA (exponential moving average) of Crest Ventures CREST
| EMA period | EMA current | EMA prev | EMA prev2 | | 5 day EMA | 379.64 | 381.03 | 383.05 | | 12 day EMA | 374.1 | 373.6 | 372.98 | | 20 day EMA | 370.85 | 370.22 | 369.51 | | 35 day EMA | 370.15 | 369.76 | 369.33 | | 50 day EMA | 372.62 | 372.45 | 372.26 |
SMA (simple moving average) of Crest Ventures CREST
| SMA period | SMA current | SMA prev | SMA prev2 | | 5 day SMA | 385.43 | 386.94 | 385.93 | | 12 day SMA | 369.57 | 367.91 | 366.8 | | 20 day SMA | 363.74 | 362.98 | 362.31 | | 35 day SMA | 368.67 | 368.71 | 368.79 | | 50 day SMA | 371.05 | 371.17 | 371.07 | | 100 day SMA | 379.74 | 380.14 | 380.59 | | 150 day SMA | 382.99 | 383.13 | 383.29 | | 200 day SMA | 387.03 | 387.33 | 387.74 |
|
|
