CreditaccessGrameen CREDITACC full analysis,charts,indicators,moving averages,SMA,DMA,EMA,ADX,MACD,RSICreditaccess Grameen CREDITACC WideScreen charts, DMA,SMA,EMA technical analysis, forecast prediction, by indicators ADX,MACD,RSI,CCI NSE stock exchange
Daily price and charts and targets CreditaccessGrameen Strong Daily Stock price targets for CreditaccessGrameen CREDITACC are 1454.5 and 1512.6 | Daily Target 1 | 1408.23 | | Daily Target 2 | 1442.67 | | Daily Target 3 | 1466.3333333333 | | Daily Target 4 | 1500.77 | | Daily Target 5 | 1524.43 |
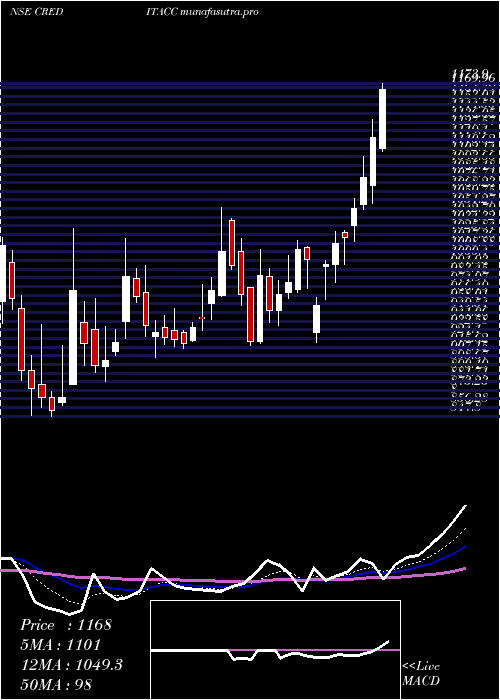
Daily price and volume Creditaccess Grameen
| Date |
Closing |
Open |
Range |
Volume |
Tue 28 October 2025 |
1477.10 (0.33%) |
1472.20 |
1431.90 - 1490.00 |
1.5031 times |
Mon 27 October 2025 |
1472.20 (3.49%) |
1422.50 |
1415.50 - 1490.10 |
2.4499 times |
Fri 24 October 2025 |
1422.50 (6.64%) |
1332.30 |
1328.50 - 1430.00 |
3.6069 times |
Thu 23 October 2025 |
1333.90 (2.95%) |
1296.30 |
1280.00 - 1345.00 |
0.6724 times |
Tue 21 October 2025 |
1295.70 (0.69%) |
1294.90 |
1290.80 - 1300.30 |
0.0272 times |
Mon 20 October 2025 |
1286.80 (-0.16%) |
1288.90 |
1265.00 - 1299.60 |
0.5376 times |
Fri 17 October 2025 |
1288.90 (-7.43%) |
1385.90 |
1281.20 - 1385.90 |
0.8284 times |
Thu 16 October 2025 |
1392.40 (0.14%) |
1390.40 |
1380.10 - 1401.90 |
0.118 times |
Wed 15 October 2025 |
1390.40 (1.44%) |
1377.00 |
1370.30 - 1398.90 |
0.0748 times |
Tue 14 October 2025 |
1370.70 (-2.64%) |
1409.00 |
1368.00 - 1409.00 |
0.1815 times |
Mon 13 October 2025 |
1407.80 (2.01%) |
1378.90 |
1360.20 - 1430.00 |
0.9798 times |
Weekly price and charts CreditaccessGrameen Strong weekly Stock price targets for CreditaccessGrameen CREDITACC are 1446.3 and 1520.9 | Weekly Target 1 | 1386.3 | | Weekly Target 2 | 1431.7 | | Weekly Target 3 | 1460.9 | | Weekly Target 4 | 1506.3 | | Weekly Target 5 | 1535.5 |
Weekly price and volumes for Creditaccess Grameen
| Date |
Closing |
Open |
Range |
Volume |
Tue 28 October 2025 |
1477.10 (3.84%) |
1422.50 |
1415.50 - 1490.10 |
1.8602 times |
Fri 24 October 2025 |
1422.50 (10.37%) |
1288.90 |
1265.00 - 1430.00 |
2.2795 times |
Fri 17 October 2025 |
1288.90 (-6.61%) |
1378.90 |
1281.20 - 1430.00 |
1.0271 times |
Fri 10 October 2025 |
1380.10 (-2.18%) |
1400.00 |
1364.40 - 1409.50 |
0.2695 times |
Fri 03 October 2025 |
1410.90 (2.42%) |
1376.00 |
1326.00 - 1417.70 |
0.588 times |
Fri 26 September 2025 |
1377.50 (1.03%) |
1363.00 |
1341.50 - 1430.00 |
0.8231 times |
Fri 19 September 2025 |
1363.40 (5.48%) |
1290.00 |
1265.00 - 1400.00 |
1.1444 times |
Fri 12 September 2025 |
1292.60 (-3.54%) |
1339.90 |
1282.00 - 1353.00 |
0.5493 times |
Fri 05 September 2025 |
1340.00 (-4.28%) |
1399.00 |
1335.60 - 1425.00 |
0.7206 times |
Fri 29 August 2025 |
1399.90 (0.09%) |
1392.90 |
1323.10 - 1410.60 |
0.7383 times |
Fri 22 August 2025 |
1398.60 (4.83%) |
1334.30 |
1310.20 - 1409.00 |
0.7392 times |

Monthly price and charts CreditaccessGrameen Strong monthly Stock price targets for CreditaccessGrameen CREDITACC are 1371.05 and 1596.15 | Monthly Target 1 | 1185.63 | | Monthly Target 2 | 1331.37 | | Monthly Target 3 | 1410.7333333333 | | Monthly Target 4 | 1556.47 | | Monthly Target 5 | 1635.83 |
Monthly price and volumes Creditaccess Grameen
| Date |
Closing |
Open |
Range |
Volume |
Tue 28 October 2025 |
1477.10 (9.16%) |
1345.70 |
1265.00 - 1490.10 |
0.3418 times |
Tue 30 September 2025 |
1353.20 (-3.34%) |
1399.00 |
1265.00 - 1430.00 |
0.2111 times |
Fri 29 August 2025 |
1399.90 (12.14%) |
1248.00 |
1198.00 - 1410.60 |
0.1905 times |
Thu 31 July 2025 |
1248.30 (3.19%) |
1222.00 |
1210.00 - 1401.30 |
0.8146 times |
Mon 30 June 2025 |
1209.70 (5.7%) |
1140.00 |
1099.70 - 1250.00 |
0.2584 times |
Fri 30 May 2025 |
1144.50 (5.14%) |
1095.00 |
1072.10 - 1253.60 |
0.6855 times |
Wed 30 April 2025 |
1088.55 (14.35%) |
951.95 |
920.00 - 1179.20 |
0.4599 times |
Fri 28 March 2025 |
951.95 (3.57%) |
932.55 |
882.15 - 1052.55 |
1.3025 times |
Fri 28 February 2025 |
919.10 (-15.12%) |
1022.00 |
847.80 - 1103.95 |
2.4603 times |
Fri 31 January 2025 |
1082.85 (22.14%) |
886.55 |
750.20 - 1119.55 |
3.2753 times |
Tue 31 December 2024 |
886.55 (-1.71%) |
908.95 |
810.00 - 946.90 |
0.3418 times |

DMA SMA EMA moving averages of Creditaccess Grameen CREDITACC
DMA (daily moving average) of Creditaccess Grameen CREDITACC
| DMA period | DMA value | | 5 day DMA | 1400.28 | | 12 day DMA | 1376.54 | | 20 day DMA | 1378.39 | | 35 day DMA | 1364.53 | | 50 day DMA | 1366.26 | | 100 day DMA | 1303.8 | | 150 day DMA | 1233.91 | | 200 day DMA | 1166.04 | EMA (exponential moving average) of Creditaccess Grameen CREDITACC
| EMA period | EMA current | EMA prev | EMA prev2 | | 5 day EMA | 1422.78 | 1395.62 | 1357.34 | | 12 day EMA | 1390.73 | 1375.03 | 1357.37 | | 20 day EMA | 1380.66 | 1370.51 | 1359.81 | | 35 day EMA | 1369.75 | 1363.43 | 1357.03 | | 50 day EMA | 1362.31 | 1357.63 | 1352.96 |
SMA (simple moving average) of Creditaccess Grameen CREDITACC
| SMA period | SMA current | SMA prev | SMA prev2 | | 5 day SMA | 1400.28 | 1362.22 | 1325.56 | | 12 day SMA | 1376.54 | 1368.59 | 1360.53 | | 20 day SMA | 1378.39 | 1373.41 | 1370.63 | | 35 day SMA | 1364.53 | 1360.61 | 1357.31 | | 50 day SMA | 1366.26 | 1362.65 | 1359.25 | | 100 day SMA | 1303.8 | 1300.73 | 1297.65 | | 150 day SMA | 1233.91 | 1230.35 | 1226.77 | | 200 day SMA | 1166.04 | 1163.21 | 1160.53 |
|
|
