GoldmanSachs CPSEETF full analysis,charts,indicators,moving averages,SMA,DMA,EMA,ADX,MACD,RSIGoldman Sachs CPSEETF WideScreen charts, DMA,SMA,EMA technical analysis, forecast prediction, by indicators ADX,MACD,RSI,CCI NSE stock exchange
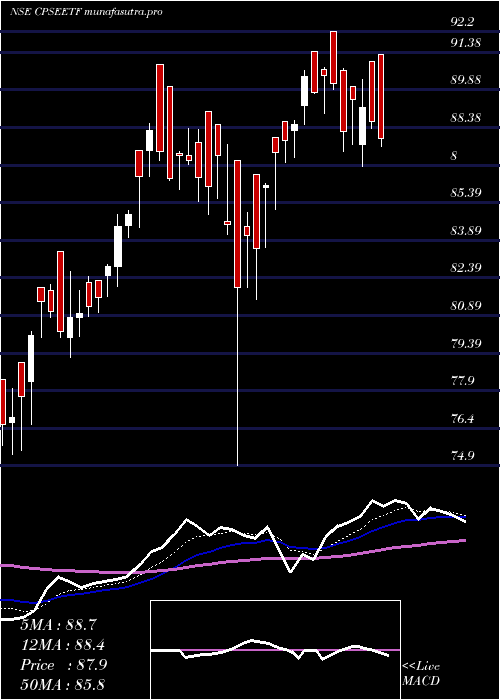
Daily price and charts and targets GoldmanSachs Strong Daily Stock price targets for GoldmanSachs CPSEETF are 92.84 and 94.41 | Daily Target 1 | 92.51 | | Daily Target 2 | 93.16 | | Daily Target 3 | 94.076666666667 | | Daily Target 4 | 94.73 | | Daily Target 5 | 95.65 |
Daily price and volume Goldman Sachs
| Date |
Closing |
Open |
Range |
Volume |
Tue 28 October 2025 |
93.82 (-0.77%) |
94.99 |
93.42 - 94.99 |
0.7488 times |
Mon 27 October 2025 |
94.55 (-0.02%) |
95.49 |
94.39 - 95.49 |
0.9826 times |
Fri 24 October 2025 |
94.57 (0.1%) |
92.11 |
92.11 - 95.09 |
1.1757 times |
Thu 23 October 2025 |
94.48 (0.41%) |
92.00 |
92.00 - 94.92 |
1.5367 times |
Tue 21 October 2025 |
94.09 (0.1%) |
96.00 |
91.65 - 96.00 |
0.5047 times |
Mon 20 October 2025 |
94.00 (0.25%) |
94.14 |
93.72 - 94.37 |
1.1873 times |
Fri 17 October 2025 |
93.77 (-0.15%) |
94.40 |
93.27 - 94.40 |
1.0602 times |
Thu 16 October 2025 |
93.91 (0.38%) |
93.92 |
93.51 - 94.00 |
1.0848 times |
Wed 15 October 2025 |
93.55 (1.26%) |
92.88 |
92.40 - 93.92 |
0.9282 times |
Tue 14 October 2025 |
92.39 (-0.69%) |
93.60 |
92.36 - 93.80 |
0.7909 times |
Mon 13 October 2025 |
93.03 (-0.6%) |
94.00 |
92.50 - 94.00 |
1.2831 times |
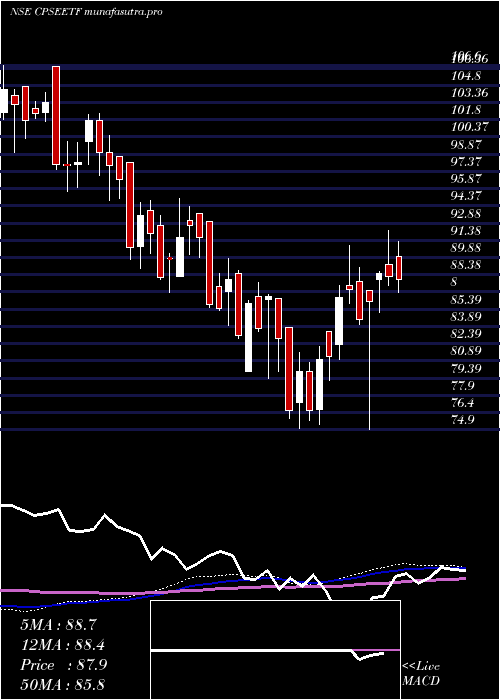
Weekly price and charts GoldmanSachs Strong weekly Stock price targets for GoldmanSachs CPSEETF are 92.59 and 94.66 | Weekly Target 1 | 92.17 | | Weekly Target 2 | 93 | | Weekly Target 3 | 94.243333333333 | | Weekly Target 4 | 95.07 | | Weekly Target 5 | 96.31 |
Weekly price and volumes for Goldman Sachs
| Date |
Closing |
Open |
Range |
Volume |
Tue 28 October 2025 |
93.82 (-0.79%) |
95.49 |
93.42 - 95.49 |
0.3463 times |
Fri 24 October 2025 |
94.57 (0.85%) |
94.14 |
91.65 - 96.00 |
0.8809 times |
Fri 17 October 2025 |
93.77 (0.19%) |
94.00 |
92.36 - 94.40 |
1.0295 times |
Fri 10 October 2025 |
93.59 (-0.11%) |
91.34 |
90.60 - 94.67 |
1.1379 times |
Fri 03 October 2025 |
93.69 (2.1%) |
91.70 |
91.00 - 93.75 |
0.7721 times |
Fri 26 September 2025 |
91.76 (-1.35%) |
93.20 |
90.07 - 94.30 |
1.8642 times |
Fri 19 September 2025 |
93.02 (1.63%) |
89.24 |
89.24 - 94.00 |
1.8368 times |
Fri 12 September 2025 |
91.53 (2.43%) |
90.81 |
86.26 - 91.70 |
0.9236 times |
Fri 05 September 2025 |
89.36 (1.74%) |
90.46 |
86.51 - 91.83 |
0.662 times |
Fri 29 August 2025 |
87.83 (-1.94%) |
87.33 |
85.67 - 91.71 |
0.5467 times |
Fri 22 August 2025 |
89.57 (-1.03%) |
91.50 |
87.79 - 92.00 |
0.5333 times |
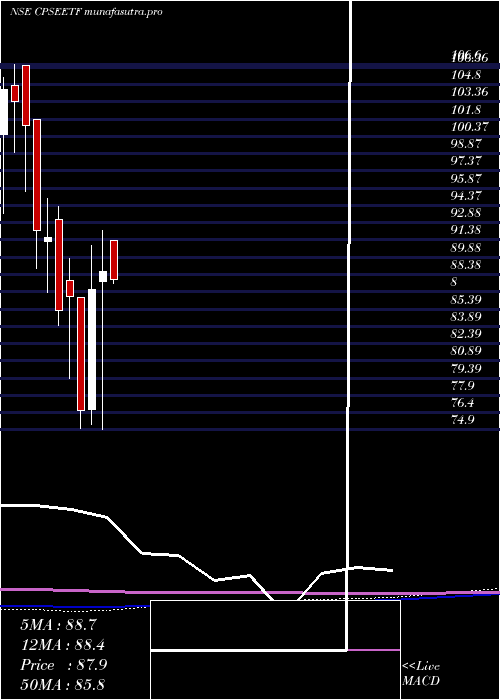
Monthly price and charts GoldmanSachs Strong monthly Stock price targets for GoldmanSachs CPSEETF are 92.21 and 97.61 | Monthly Target 1 | 88.07 | | Monthly Target 2 | 90.95 | | Monthly Target 3 | 93.473333333333 | | Monthly Target 4 | 96.35 | | Monthly Target 5 | 98.87 |
Monthly price and volumes Goldman Sachs
| Date |
Closing |
Open |
Range |
Volume |
Tue 28 October 2025 |
93.82 (1.59%) |
92.35 |
90.60 - 96.00 |
0.5238 times |
Tue 30 September 2025 |
92.35 (5.15%) |
90.46 |
86.26 - 94.30 |
0.7482 times |
Fri 29 August 2025 |
87.83 (-3.04%) |
91.00 |
85.67 - 93.35 |
0.321 times |
Thu 31 July 2025 |
90.58 (-3.87%) |
94.60 |
88.93 - 95.91 |
0.6447 times |
Mon 30 June 2025 |
94.23 (2.92%) |
92.39 |
88.95 - 96.16 |
0.8466 times |
Fri 30 May 2025 |
91.56 (3.31%) |
91.29 |
85.00 - 94.00 |
1.2308 times |
Wed 30 April 2025 |
88.63 (1.79%) |
87.80 |
74.90 - 92.20 |
1.177 times |
Fri 28 March 2025 |
87.07 (13.73%) |
76.63 |
75.36 - 90.90 |
1.5177 times |
Fri 28 February 2025 |
76.56 (-11.48%) |
86.35 |
75.01 - 86.35 |
1.5878 times |
Fri 31 January 2025 |
86.49 (1.41%) |
87.85 |
79.34 - 89.80 |
1.4025 times |
Tue 31 December 2024 |
85.29 (-6.92%) |
93.13 |
83.95 - 94.30 |
1.0625 times |
DMA SMA EMA moving averages of Goldman Sachs CPSEETF
DMA (daily moving average) of Goldman Sachs CPSEETF
| DMA period | DMA value | | 5 day DMA | 94.3 | | 12 day DMA | 93.81 | | 20 day DMA | 93.45 | | 35 day DMA | 92.76 | | 50 day DMA | 91.8 | | 100 day DMA | 92.19 | | 150 day DMA | 91.07 | | 200 day DMA | 88.71 | EMA (exponential moving average) of Goldman Sachs CPSEETF
| EMA period | EMA current | EMA prev | EMA prev2 | | 5 day EMA | 94.15 | 94.32 | 94.21 | | 12 day EMA | 93.86 | 93.87 | 93.75 | | 20 day EMA | 93.49 | 93.45 | 93.33 | | 35 day EMA | 92.67 | 92.6 | 92.49 | | 50 day EMA | 91.93 | 91.85 | 91.74 |
SMA (simple moving average) of Goldman Sachs CPSEETF
| SMA period | SMA current | SMA prev | SMA prev2 | | 5 day SMA | 94.3 | 94.34 | 94.18 | | 12 day SMA | 93.81 | 93.73 | 93.55 | | 20 day SMA | 93.45 | 93.35 | 93.27 | | 35 day SMA | 92.76 | 92.63 | 92.49 | | 50 day SMA | 91.8 | 91.74 | 91.66 | | 100 day SMA | 92.19 | 92.17 | 92.13 | | 150 day SMA | 91.07 | 91.01 | 90.93 | | 200 day SMA | 88.71 | 88.66 | 88.63 |
|
|
