CoralIndia CORALFINAC full analysis,charts,indicators,moving averages,SMA,DMA,EMA,ADX,MACD,RSICoral India CORALFINAC WideScreen charts, DMA,SMA,EMA technical analysis, forecast prediction, by indicators ADX,MACD,RSI,CCI NSE stock exchange
operates under Housing Finance sector
Daily price and charts and targets CoralIndia Strong Daily Stock price targets for CoralIndia CORALFINAC are 42.81 and 43.37 | Daily Target 1 | 42.64 | | Daily Target 2 | 42.97 | | Daily Target 3 | 43.196666666667 | | Daily Target 4 | 43.53 | | Daily Target 5 | 43.76 |
Daily price and volume Coral India
| Date |
Closing |
Open |
Range |
Volume |
Tue 28 October 2025 |
43.31 (0.02%) |
43.42 |
42.86 - 43.42 |
0.6348 times |
Mon 27 October 2025 |
43.30 (0.53%) |
43.28 |
43.00 - 44.29 |
0.4424 times |
Fri 24 October 2025 |
43.07 (-0.85%) |
44.44 |
42.51 - 44.44 |
1.8535 times |
Thu 23 October 2025 |
43.44 (-2.43%) |
43.70 |
43.15 - 44.73 |
0.884 times |
Tue 21 October 2025 |
44.52 (2.04%) |
44.72 |
43.10 - 44.79 |
0.8974 times |
Mon 20 October 2025 |
43.63 (0.83%) |
43.74 |
42.72 - 44.28 |
0.9353 times |
Fri 17 October 2025 |
43.27 (-0.3%) |
43.27 |
42.73 - 44.35 |
1.2384 times |
Thu 16 October 2025 |
43.40 (-0.44%) |
44.49 |
43.01 - 44.49 |
1.1294 times |
Wed 15 October 2025 |
43.59 (-0.43%) |
43.10 |
43.03 - 44.23 |
0.4858 times |
Tue 14 October 2025 |
43.78 (-0.16%) |
43.60 |
42.30 - 44.71 |
1.4992 times |
Mon 13 October 2025 |
43.85 (-0.95%) |
43.80 |
43.12 - 44.18 |
0.5661 times |
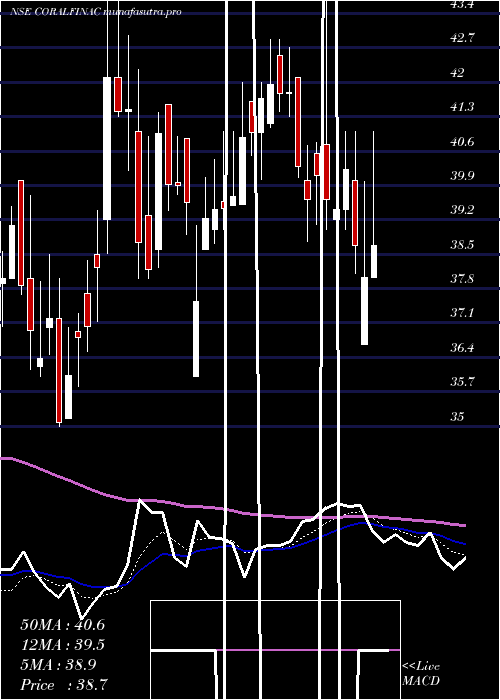
Weekly price and charts CoralIndia Strong weekly Stock price targets for CoralIndia CORALFINAC are 43.09 and 44.52 | Weekly Target 1 | 42.06 | | Weekly Target 2 | 42.68 | | Weekly Target 3 | 43.486666666667 | | Weekly Target 4 | 44.11 | | Weekly Target 5 | 44.92 |
Weekly price and volumes for Coral India
| Date |
Closing |
Open |
Range |
Volume |
Tue 28 October 2025 |
43.31 (0.56%) |
43.28 |
42.86 - 44.29 |
0.1991 times |
Fri 24 October 2025 |
43.07 (-0.46%) |
43.74 |
42.51 - 44.79 |
0.845 times |
Fri 17 October 2025 |
43.27 (-2.26%) |
43.80 |
42.30 - 44.71 |
0.9094 times |
Fri 10 October 2025 |
44.27 (0.52%) |
44.85 |
43.20 - 47.19 |
1.2128 times |
Fri 03 October 2025 |
44.04 (3.28%) |
43.50 |
41.71 - 45.97 |
1.623 times |
Fri 26 September 2025 |
42.64 (-7.71%) |
46.00 |
42.15 - 46.49 |
0.8482 times |
Fri 19 September 2025 |
46.20 (0.57%) |
46.90 |
46.00 - 50.90 |
2.3333 times |
Fri 12 September 2025 |
45.94 (7.06%) |
42.91 |
42.72 - 46.90 |
1.1544 times |
Fri 05 September 2025 |
42.91 (1.01%) |
42.52 |
41.30 - 43.99 |
0.4473 times |
Fri 29 August 2025 |
42.48 (-3.28%) |
44.44 |
40.75 - 44.44 |
0.4276 times |
Fri 22 August 2025 |
43.92 (-0.2%) |
44.52 |
43.71 - 45.80 |
0.6865 times |
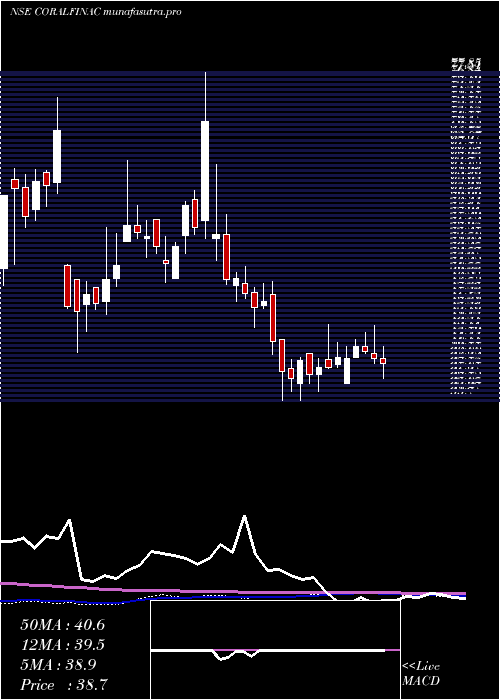
Monthly price and charts CoralIndia Strong monthly Stock price targets for CoralIndia CORALFINAC are 40.36 and 45.25 | Monthly Target 1 | 39.38 | | Monthly Target 2 | 41.34 | | Monthly Target 3 | 44.266666666667 | | Monthly Target 4 | 46.23 | | Monthly Target 5 | 49.16 |
Monthly price and volumes Coral India
| Date |
Closing |
Open |
Range |
Volume |
Tue 28 October 2025 |
43.31 (0.51%) |
43.98 |
42.30 - 47.19 |
0.6332 times |
Tue 30 September 2025 |
43.09 (1.44%) |
42.52 |
41.30 - 50.90 |
1.0195 times |
Fri 29 August 2025 |
42.48 (-4.71%) |
45.90 |
40.75 - 46.70 |
0.4028 times |
Thu 31 July 2025 |
44.58 (-3.51%) |
46.29 |
43.40 - 52.49 |
1.7281 times |
Mon 30 June 2025 |
46.20 (0.26%) |
45.55 |
41.50 - 51.19 |
1.0662 times |
Fri 30 May 2025 |
46.08 (16.33%) |
39.21 |
36.65 - 49.97 |
1.0375 times |
Wed 30 April 2025 |
39.61 (3.75%) |
38.60 |
36.00 - 43.88 |
0.5925 times |
Fri 28 March 2025 |
38.18 (4.2%) |
36.00 |
33.70 - 44.00 |
1.1426 times |
Fri 28 February 2025 |
36.64 (-20.86%) |
46.51 |
33.70 - 49.79 |
0.7302 times |
Fri 31 January 2025 |
46.30 (-18.74%) |
58.00 |
43.50 - 58.80 |
1.6475 times |
Tue 31 December 2024 |
56.98 (-20.08%) |
55.56 |
52.50 - 65.49 |
1.5359 times |

DMA SMA EMA moving averages of Coral India CORALFINAC
DMA (daily moving average) of Coral India CORALFINAC
| DMA period | DMA value | | 5 day DMA | 43.53 | | 12 day DMA | 43.62 | | 20 day DMA | 43.8 | | 35 day DMA | 44.38 | | 50 day DMA | 44.05 | | 100 day DMA | 45.02 | | 150 day DMA | 43.84 | | 200 day DMA | 43.67 | EMA (exponential moving average) of Coral India CORALFINAC
| EMA period | EMA current | EMA prev | EMA prev2 | | 5 day EMA | 43.4 | 43.45 | 43.52 | | 12 day EMA | 43.61 | 43.67 | 43.74 | | 20 day EMA | 43.81 | 43.86 | 43.92 | | 35 day EMA | 43.91 | 43.95 | 43.99 | | 50 day EMA | 44.05 | 44.08 | 44.11 |
SMA (simple moving average) of Coral India CORALFINAC
| SMA period | SMA current | SMA prev | SMA prev2 | | 5 day SMA | 43.53 | 43.59 | 43.59 | | 12 day SMA | 43.62 | 43.68 | 43.81 | | 20 day SMA | 43.8 | 43.77 | 43.76 | | 35 day SMA | 44.38 | 44.37 | 44.38 | | 50 day SMA | 44.05 | 44.08 | 44.12 | | 100 day SMA | 45.02 | 45.04 | 45.07 | | 150 day SMA | 43.84 | 43.8 | 43.75 | | 200 day SMA | 43.67 | 43.72 | 43.79 |
|
|
