CoolCaps COOLCAPS_SM full analysis,charts,indicators,moving averages,SMA,DMA,EMA,ADX,MACD,RSICool Caps COOLCAPS_SM WideScreen charts, DMA,SMA,EMA technical analysis, forecast prediction, by indicators ADX,MACD,RSI,CCI NSE stock exchange
Daily price and charts and targets CoolCaps Strong Daily Stock price targets for CoolCaps COOLCAPS_SM are 81.03 and 83.98 | Daily Target 1 | 80.37 | | Daily Target 2 | 81.68 | | Daily Target 3 | 83.316666666667 | | Daily Target 4 | 84.63 | | Daily Target 5 | 86.27 |
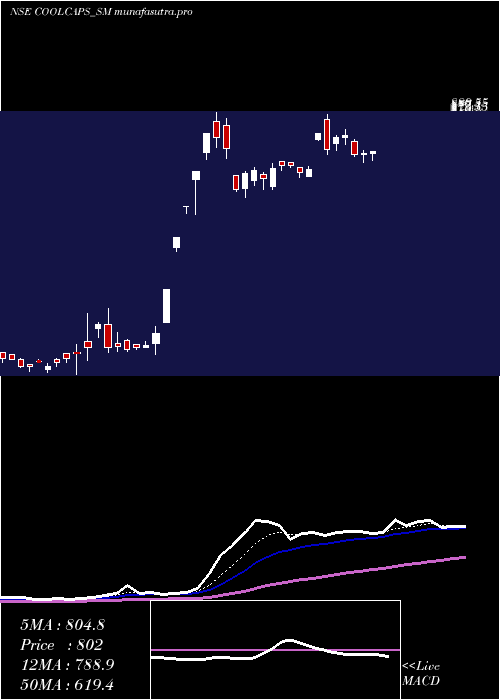
Daily price and volume Cool Caps
| Date |
Closing |
Open |
Range |
Volume |
Wed 29 October 2025 |
83.00 (0.24%) |
84.95 |
82.00 - 84.95 |
1.4402 times |
Tue 28 October 2025 |
82.80 (1.41%) |
82.00 |
81.05 - 83.00 |
1.2373 times |
Mon 27 October 2025 |
81.65 (1.94%) |
82.00 |
80.40 - 82.50 |
0.6694 times |
Fri 24 October 2025 |
80.10 (-2.73%) |
82.40 |
79.05 - 83.75 |
1.0345 times |
Thu 23 October 2025 |
82.35 (-1.38%) |
83.50 |
82.00 - 84.50 |
1.0953 times |
Tue 21 October 2025 |
83.50 (1.71%) |
83.50 |
83.00 - 83.90 |
0.2231 times |
Mon 20 October 2025 |
82.10 (-0.85%) |
83.00 |
81.90 - 84.00 |
0.5882 times |
Fri 17 October 2025 |
82.80 (-1.08%) |
84.10 |
82.00 - 84.50 |
0.6288 times |
Thu 16 October 2025 |
83.70 (-1.88%) |
85.55 |
82.00 - 85.55 |
1.359 times |
Wed 15 October 2025 |
85.30 (3.52%) |
84.95 |
84.45 - 88.60 |
1.7241 times |
Tue 14 October 2025 |
82.40 (-1.26%) |
85.00 |
82.25 - 85.10 |
0.6085 times |
Weekly price and charts CoolCaps Strong weekly Stock price targets for CoolCaps COOLCAPS_SM are 81.7 and 86.25 | Weekly Target 1 | 78.23 | | Weekly Target 2 | 80.62 | | Weekly Target 3 | 82.783333333333 | | Weekly Target 4 | 85.17 | | Weekly Target 5 | 87.33 |
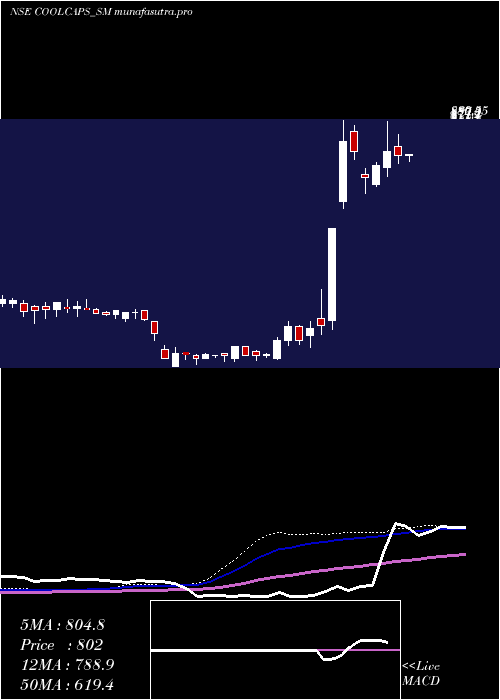
Weekly price and volumes for Cool Caps
| Date |
Closing |
Open |
Range |
Volume |
Wed 29 October 2025 |
83.00 (3.62%) |
82.00 |
80.40 - 84.95 |
0.3495 times |
Fri 24 October 2025 |
80.10 (-3.26%) |
83.00 |
79.05 - 84.50 |
0.3071 times |
Fri 17 October 2025 |
82.80 (-2.59%) |
85.60 |
82.00 - 88.60 |
0.5062 times |
Fri 10 October 2025 |
85.00 (-6.08%) |
88.10 |
80.10 - 90.00 |
0.7329 times |
Fri 03 October 2025 |
90.50 (-5.33%) |
97.80 |
86.90 - 97.80 |
0.7308 times |
Fri 26 September 2025 |
95.60 (-7.36%) |
108.00 |
89.05 - 109.00 |
2.6605 times |
Fri 19 September 2025 |
103.20 (8.06%) |
99.00 |
91.00 - 106.90 |
2.4995 times |
Fri 12 September 2025 |
95.50 (16.11%) |
82.70 |
81.65 - 98.75 |
1.273 times |
Fri 05 September 2025 |
82.25 (-1.85%) |
83.00 |
81.00 - 85.25 |
0.3749 times |
Fri 29 August 2025 |
83.80 (2.38%) |
80.30 |
75.00 - 88.90 |
0.5656 times |
Fri 22 August 2025 |
81.85 (-2.68%) |
86.00 |
79.50 - 86.00 |
0.3198 times |
Monthly price and charts CoolCaps Strong monthly Stock price targets for CoolCaps COOLCAPS_SM are 74.8 and 87.25 | Monthly Target 1 | 72.07 | | Monthly Target 2 | 77.53 | | Monthly Target 3 | 84.516666666667 | | Monthly Target 4 | 89.98 | | Monthly Target 5 | 96.97 |
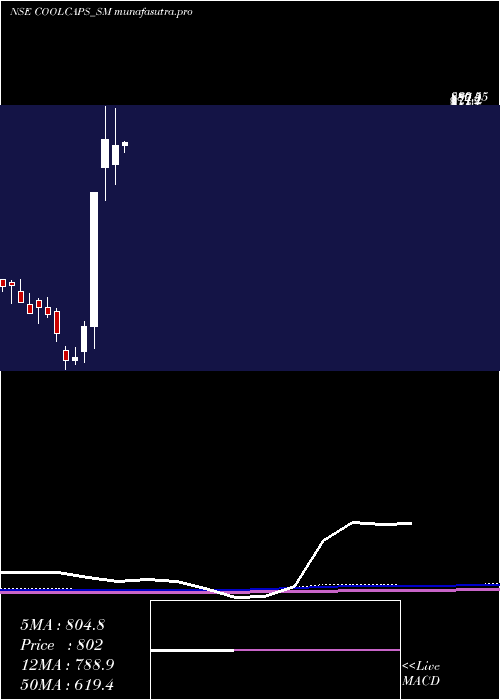
Monthly price and volumes Cool Caps
| Date |
Closing |
Open |
Range |
Volume |
Wed 29 October 2025 |
83.00 (-8.59%) |
89.05 |
79.05 - 91.50 |
1.167 times |
Tue 30 September 2025 |
90.80 (8.35%) |
83.00 |
81.00 - 109.00 |
3.7785 times |
Fri 29 August 2025 |
83.80 (9.54%) |
76.55 |
75.00 - 88.90 |
0.8461 times |
Thu 31 July 2025 |
76.50 (-90.74%) |
811.00 |
76.50 - 838.00 |
1.4096 times |
Mon 30 June 2025 |
826.15 (5.93%) |
757.00 |
756.05 - 834.40 |
0.1369 times |
Fri 30 May 2025 |
779.90 (-2%) |
795.85 |
759.00 - 819.80 |
0.2109 times |
Wed 30 April 2025 |
795.85 (-1.5%) |
754.00 |
710.50 - 876.95 |
0.1478 times |
Mon 07 October 2024 |
808.00 (16.57%) |
747.00 |
677.10 - 880.55 |
0.4431 times |
Mon 30 September 2024 |
693.15 (71.85%) |
403.35 |
355.10 - 693.15 |
1.8224 times |
Fri 30 August 2024 |
403.35 (20.35%) |
349.70 |
325.00 - 415.00 |
0.0378 times |
Wed 31 July 2024 |
335.15 (1.56%) |
330.00 |
321.00 - 357.00 |
0.0105 times |
DMA SMA EMA moving averages of Cool Caps COOLCAPS_SM
DMA (daily moving average) of Cool Caps COOLCAPS_SM
| DMA period | DMA value | | 5 day DMA | 81.98 | | 12 day DMA | 82.76 | | 20 day DMA | 84.44 | | 35 day DMA | 88.37 | | 50 day DMA | 86.56 | | 100 day DMA | 230.04 | | 150 day DMA | 403.68 | | 200 day DMA | 392.6 | EMA (exponential moving average) of Cool Caps COOLCAPS_SM
| EMA period | EMA current | EMA prev | EMA prev2 | | 5 day EMA | 82.46 | 82.19 | 81.89 | | 12 day EMA | 83.25 | 83.29 | 83.38 | | 20 day EMA | 84.48 | 84.64 | 84.83 | | 35 day EMA | 84.84 | 84.95 | 85.08 | | 50 day EMA | 85.82 | 85.93 | 86.06 |
SMA (simple moving average) of Cool Caps COOLCAPS_SM
| SMA period | SMA current | SMA prev | SMA prev2 | | 5 day SMA | 81.98 | 82.08 | 81.94 | | 12 day SMA | 82.76 | 82.93 | 82.85 | | 20 day SMA | 84.44 | 85 | 85.64 | | 35 day SMA | 88.37 | 88.35 | 88.33 | | 50 day SMA | 86.56 | 86.58 | 86.58 | | 100 day SMA | 230.04 | 237.18 | 244.3 | | 150 day SMA | 403.68 | 405.88 | 408.05 | | 200 day SMA | 392.6 | 393.89 | 395.17 |
|
|
