NipInd CONSUMBEES full analysis,charts,indicators,moving averages,SMA,DMA,EMA,ADX,MACD,RSINip Ind CONSUMBEES WideScreen charts, DMA,SMA,EMA technical analysis, forecast prediction, by indicators ADX,MACD,RSI,CCI NSE stock exchange
Daily price and charts and targets NipInd Strong Daily Stock price targets for NipInd CONSUMBEES are 136.21 and 141.56 | Daily Target 1 | 135.26 | | Daily Target 2 | 137.15 | | Daily Target 3 | 140.60666666667 | | Daily Target 4 | 142.5 | | Daily Target 5 | 145.96 |
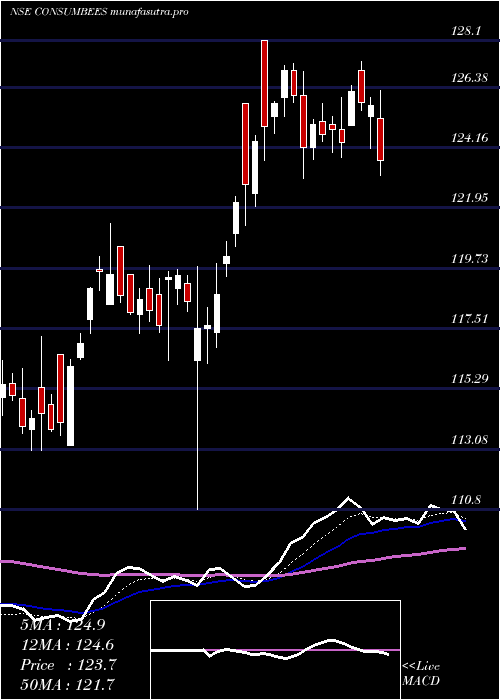
Daily price and volume Nip Ind
| Date |
Closing |
Open |
Range |
Volume |
Thu 30 October 2025 |
139.05 (-0.58%) |
144.06 |
138.71 - 144.06 |
0.6025 times |
Wed 29 October 2025 |
139.86 (0.35%) |
140.76 |
139.00 - 140.76 |
0.6536 times |
Tue 28 October 2025 |
139.37 (-0.44%) |
142.00 |
138.86 - 144.18 |
0.4431 times |
Mon 27 October 2025 |
139.98 (0.67%) |
139.15 |
139.12 - 140.19 |
0.6244 times |
Fri 24 October 2025 |
139.05 (-0.37%) |
139.55 |
138.67 - 139.75 |
0.6923 times |
Thu 23 October 2025 |
139.56 (-0.81%) |
144.00 |
139.37 - 144.00 |
1.3356 times |
Tue 21 October 2025 |
140.70 (0.38%) |
144.38 |
139.16 - 144.38 |
0.4823 times |
Mon 20 October 2025 |
140.17 (-0.1%) |
141.63 |
140.00 - 141.91 |
1.2599 times |
Fri 17 October 2025 |
140.31 (1.5%) |
138.50 |
138.30 - 140.58 |
2.0976 times |
Thu 16 October 2025 |
138.24 (0.99%) |
137.57 |
137.00 - 138.99 |
1.8087 times |
Wed 15 October 2025 |
136.89 (0.96%) |
136.95 |
135.57 - 139.66 |
0.8928 times |
Weekly price and charts NipInd Strong weekly Stock price targets for NipInd CONSUMBEES are 136.15 and 141.62 | Weekly Target 1 | 135.18 | | Weekly Target 2 | 137.11 | | Weekly Target 3 | 140.64666666667 | | Weekly Target 4 | 142.58 | | Weekly Target 5 | 146.12 |
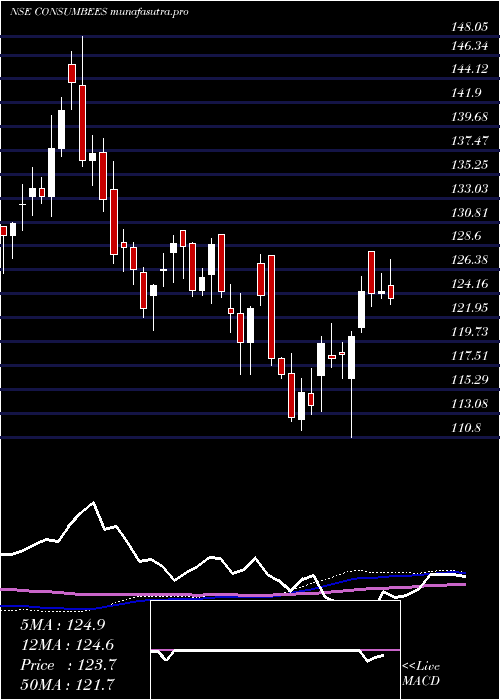
Weekly price and volumes for Nip Ind
| Date |
Closing |
Open |
Range |
Volume |
Thu 30 October 2025 |
139.05 (0%) |
139.15 |
138.71 - 144.18 |
0.4621 times |
Fri 24 October 2025 |
139.05 (-0.9%) |
141.63 |
138.67 - 144.38 |
0.7498 times |
Fri 17 October 2025 |
140.31 (2.67%) |
136.66 |
135.11 - 140.58 |
1.3875 times |
Fri 10 October 2025 |
136.66 (1.16%) |
136.31 |
134.51 - 137.00 |
0.6483 times |
Fri 03 October 2025 |
135.09 (0.43%) |
134.53 |
133.57 - 135.22 |
0.5355 times |
Fri 26 September 2025 |
134.51 (-2.97%) |
137.75 |
134.18 - 139.67 |
1.8527 times |
Fri 19 September 2025 |
138.63 (0.73%) |
138.89 |
137.20 - 139.57 |
1.1761 times |
Fri 12 September 2025 |
137.62 (0%) |
139.00 |
137.02 - 141.34 |
1.2709 times |
Fri 05 September 2025 |
137.62 (2.5%) |
134.78 |
132.44 - 140.41 |
1.2927 times |
Fri 29 August 2025 |
134.26 (-1.05%) |
137.32 |
133.60 - 139.29 |
0.6244 times |
Fri 22 August 2025 |
135.69 (3.36%) |
132.43 |
132.09 - 136.77 |
2.269 times |
Monthly price and charts NipInd Strong monthly Stock price targets for NipInd CONSUMBEES are 136.36 and 147.07 | Monthly Target 1 | 128.32 | | Monthly Target 2 | 133.69 | | Monthly Target 3 | 139.03333333333 | | Monthly Target 4 | 144.4 | | Monthly Target 5 | 149.74 |
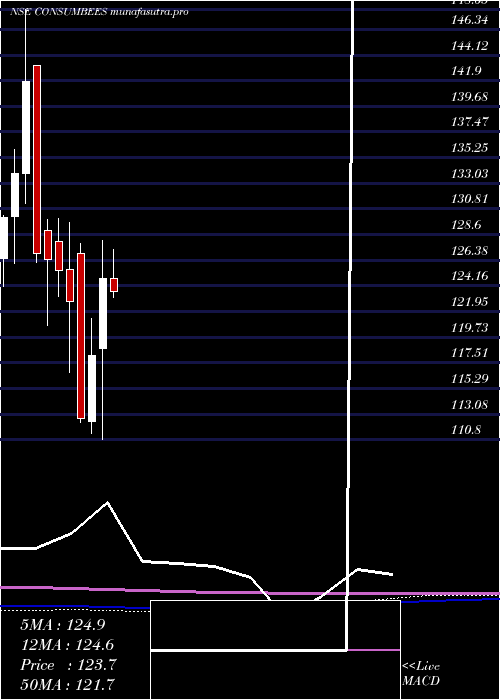
Monthly price and volumes Nip Ind
| Date |
Closing |
Open |
Range |
Volume |
Thu 30 October 2025 |
139.05 (3.61%) |
134.50 |
133.67 - 144.38 |
1.0013 times |
Tue 30 September 2025 |
134.20 (-0.04%) |
134.78 |
132.44 - 141.34 |
1.6024 times |
Fri 29 August 2025 |
134.26 (3.27%) |
130.18 |
128.97 - 139.29 |
1.1087 times |
Thu 31 July 2025 |
130.01 (-0.71%) |
132.25 |
127.98 - 134.29 |
0.8378 times |
Mon 30 June 2025 |
130.94 (3.75%) |
126.21 |
122.10 - 132.45 |
0.8441 times |
Fri 30 May 2025 |
126.21 (1.11%) |
124.83 |
120.94 - 130.00 |
0.8526 times |
Wed 30 April 2025 |
124.83 (5.64%) |
118.75 |
110.86 - 128.10 |
0.7784 times |
Fri 28 March 2025 |
118.16 (4.83%) |
112.45 |
111.43 - 121.38 |
1.1329 times |
Fri 28 February 2025 |
112.72 (-8.22%) |
127.00 |
112.34 - 127.84 |
1.1315 times |
Fri 31 January 2025 |
122.81 (-2.16%) |
125.60 |
116.67 - 129.64 |
0.7103 times |
Tue 31 December 2024 |
125.52 (-0.74%) |
127.99 |
123.24 - 130.00 |
0.5249 times |
DMA SMA EMA moving averages of Nip Ind CONSUMBEES
DMA (daily moving average) of Nip Ind CONSUMBEES
| DMA period | DMA value | | 5 day DMA | 139.46 | | 12 day DMA | 139.06 | | 20 day DMA | 137.73 | | 35 day DMA | 137.49 | | 50 day DMA | 137.12 | | 100 day DMA | 133.47 | | 150 day DMA | 130.34 | | 200 day DMA | 127.48 | EMA (exponential moving average) of Nip Ind CONSUMBEES
| EMA period | EMA current | EMA prev | EMA prev2 | | 5 day EMA | 139.42 | 139.61 | 139.48 | | 12 day EMA | 138.92 | 138.9 | 138.72 | | 20 day EMA | 138.31 | 138.23 | 138.06 | | 35 day EMA | 137.55 | 137.46 | 137.32 | | 50 day EMA | 136.92 | 136.83 | 136.71 |
SMA (simple moving average) of Nip Ind CONSUMBEES
| SMA period | SMA current | SMA prev | SMA prev2 | | 5 day SMA | 139.46 | 139.56 | 139.73 | | 12 day SMA | 139.06 | 138.83 | 138.56 | | 20 day SMA | 137.73 | 137.48 | 137.22 | | 35 day SMA | 137.49 | 137.47 | 137.43 | | 50 day SMA | 137.12 | 137.03 | 136.86 | | 100 day SMA | 133.47 | 133.36 | 133.23 | | 150 day SMA | 130.34 | 130.21 | 130.07 | | 200 day SMA | 127.48 | 127.41 | 127.34 |
|
|
