ConfidencePetro CONFIPET full analysis,charts,indicators,moving averages,SMA,DMA,EMA,ADX,MACD,RSIConfidence Petro CONFIPET WideScreen charts, DMA,SMA,EMA technical analysis, forecast prediction, by indicators ADX,MACD,RSI,CCI NSE stock exchange
Daily price and charts and targets ConfidencePetro Strong Daily Stock price targets for ConfidencePetro CONFIPET are 41.22 and 43.07 | Daily Target 1 | 39.83 | | Daily Target 2 | 40.76 | | Daily Target 3 | 41.68 | | Daily Target 4 | 42.61 | | Daily Target 5 | 43.53 |
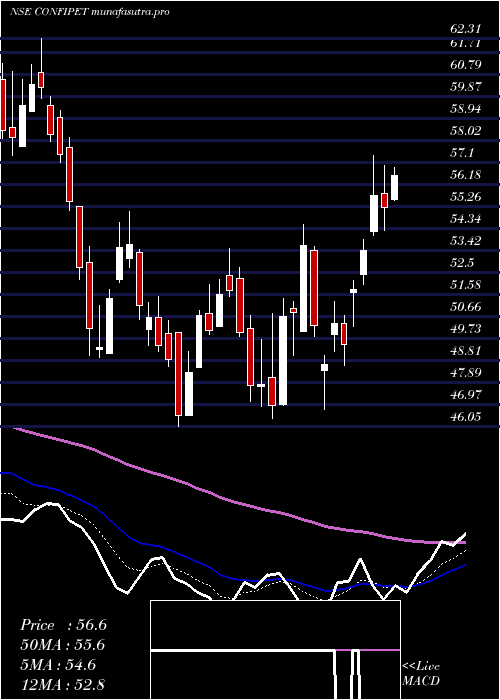
Daily price and volume Confidence Petro
| Date |
Closing |
Open |
Range |
Volume |
Tue 28 October 2025 |
41.69 (1.56%) |
41.00 |
40.75 - 42.60 |
0.8596 times |
Mon 27 October 2025 |
41.05 (-0.46%) |
41.23 |
40.71 - 41.50 |
0.6561 times |
Fri 24 October 2025 |
41.24 (-2.51%) |
42.38 |
41.06 - 42.38 |
0.8413 times |
Thu 23 October 2025 |
42.30 (0.76%) |
42.00 |
42.00 - 42.66 |
0.7126 times |
Tue 21 October 2025 |
41.98 (2.34%) |
41.23 |
41.15 - 42.50 |
0.6117 times |
Mon 20 October 2025 |
41.02 (1.31%) |
40.31 |
40.07 - 41.25 |
0.9947 times |
Fri 17 October 2025 |
40.49 (-1.7%) |
41.19 |
40.30 - 41.81 |
2.1388 times |
Thu 16 October 2025 |
41.19 (0.27%) |
41.29 |
41.09 - 41.62 |
0.7214 times |
Wed 15 October 2025 |
41.08 (-0.39%) |
41.80 |
40.93 - 41.85 |
1.3039 times |
Tue 14 October 2025 |
41.24 (-2.25%) |
42.40 |
41.21 - 42.59 |
1.16 times |
Mon 13 October 2025 |
42.19 (-1.36%) |
42.00 |
42.00 - 42.77 |
1.3712 times |
Weekly price and charts ConfidencePetro Strong weekly Stock price targets for ConfidencePetro CONFIPET are 41.2 and 43.09 | Weekly Target 1 | 39.78 | | Weekly Target 2 | 40.73 | | Weekly Target 3 | 41.666666666667 | | Weekly Target 4 | 42.62 | | Weekly Target 5 | 43.56 |
Weekly price and volumes for Confidence Petro
| Date |
Closing |
Open |
Range |
Volume |
Tue 28 October 2025 |
41.69 (1.09%) |
41.23 |
40.71 - 42.60 |
0.2823 times |
Fri 24 October 2025 |
41.24 (1.85%) |
40.31 |
40.07 - 42.66 |
0.5885 times |
Fri 17 October 2025 |
40.49 (-5.33%) |
42.00 |
40.30 - 42.77 |
1.2468 times |
Fri 10 October 2025 |
42.77 (-6.68%) |
45.98 |
41.74 - 48.25 |
3.1293 times |
Fri 03 October 2025 |
45.83 (0.73%) |
45.68 |
44.85 - 46.10 |
0.4639 times |
Fri 26 September 2025 |
45.50 (-4.51%) |
47.74 |
45.25 - 48.01 |
1.202 times |
Fri 19 September 2025 |
47.65 (-2.95%) |
49.10 |
47.42 - 50.73 |
1.4278 times |
Fri 12 September 2025 |
49.10 (1.7%) |
48.48 |
48.03 - 49.85 |
0.5961 times |
Fri 05 September 2025 |
48.28 (2.07%) |
47.50 |
47.42 - 49.68 |
0.528 times |
Fri 29 August 2025 |
47.30 (-4.6%) |
50.00 |
47.00 - 50.13 |
0.5353 times |
Fri 22 August 2025 |
49.58 (3.55%) |
48.97 |
48.40 - 51.34 |
0.6737 times |

Monthly price and charts ConfidencePetro Strong monthly Stock price targets for ConfidencePetro CONFIPET are 36.79 and 44.97 | Monthly Target 1 | 35.16 | | Monthly Target 2 | 38.42 | | Monthly Target 3 | 43.336666666667 | | Monthly Target 4 | 46.6 | | Monthly Target 5 | 51.52 |
Monthly price and volumes Confidence Petro
| Date |
Closing |
Open |
Range |
Volume |
Tue 28 October 2025 |
41.69 (-7.48%) |
45.06 |
40.07 - 48.25 |
1.0419 times |
Tue 30 September 2025 |
45.06 (-4.74%) |
47.50 |
44.85 - 50.73 |
0.7561 times |
Fri 29 August 2025 |
47.30 (-9.07%) |
51.82 |
47.00 - 52.64 |
0.6406 times |
Thu 31 July 2025 |
52.02 (-0.36%) |
52.45 |
50.84 - 58.43 |
1.4221 times |
Mon 30 June 2025 |
52.21 (-11.46%) |
59.00 |
49.95 - 63.39 |
1.8188 times |
Fri 30 May 2025 |
58.97 (14.11%) |
52.00 |
48.25 - 63.69 |
0.9982 times |
Wed 30 April 2025 |
51.68 (10.14%) |
46.95 |
46.75 - 59.20 |
0.9202 times |
Fri 28 March 2025 |
46.92 (-11%) |
52.89 |
46.05 - 55.05 |
1.1788 times |
Fri 28 February 2025 |
52.72 (-23.01%) |
66.98 |
52.20 - 68.99 |
0.5194 times |
Fri 31 January 2025 |
68.48 (-2.13%) |
70.10 |
65.35 - 77.49 |
0.7039 times |
Tue 31 December 2024 |
69.97 (-6.95%) |
75.40 |
68.89 - 84.04 |
0.8801 times |

DMA SMA EMA moving averages of Confidence Petro CONFIPET
DMA (daily moving average) of Confidence Petro CONFIPET
| DMA period | DMA value | | 5 day DMA | 41.65 | | 12 day DMA | 41.52 | | 20 day DMA | 42.98 | | 35 day DMA | 45.07 | | 50 day DMA | 46.18 | | 100 day DMA | 50.42 | | 150 day DMA | 51.7 | | 200 day DMA | 54.35 | EMA (exponential moving average) of Confidence Petro CONFIPET
| EMA period | EMA current | EMA prev | EMA prev2 | | 5 day EMA | 41.5 | 41.41 | 41.59 | | 12 day EMA | 42.01 | 42.07 | 42.26 | | 20 day EMA | 42.92 | 43.05 | 43.26 | | 35 day EMA | 44.38 | 44.54 | 44.75 | | 50 day EMA | 46 | 46.18 | 46.39 |
SMA (simple moving average) of Confidence Petro CONFIPET
| SMA period | SMA current | SMA prev | SMA prev2 | | 5 day SMA | 41.65 | 41.52 | 41.41 | | 12 day SMA | 41.52 | 41.57 | 41.86 | | 20 day SMA | 42.98 | 43.17 | 43.44 | | 35 day SMA | 45.07 | 45.26 | 45.47 | | 50 day SMA | 46.18 | 46.38 | 46.53 | | 100 day SMA | 50.42 | 50.61 | 50.8 | | 150 day SMA | 51.7 | 51.76 | 51.81 | | 200 day SMA | 54.35 | 54.5 | 54.68 |
|
|
