CoffeeDay COFFEEDAY full analysis,charts,indicators,moving averages,SMA,DMA,EMA,ADX,MACD,RSICoffee Day COFFEEDAY WideScreen charts, DMA,SMA,EMA technical analysis, forecast prediction, by indicators ADX,MACD,RSI,CCI NSE stock exchange
Daily price and charts and targets CoffeeDay Strong Daily Stock price targets for CoffeeDay COFFEEDAY are 45.47 and 49.11 | Daily Target 1 | 44.73 | | Daily Target 2 | 46.21 | | Daily Target 3 | 48.373333333333 | | Daily Target 4 | 49.85 | | Daily Target 5 | 52.01 |
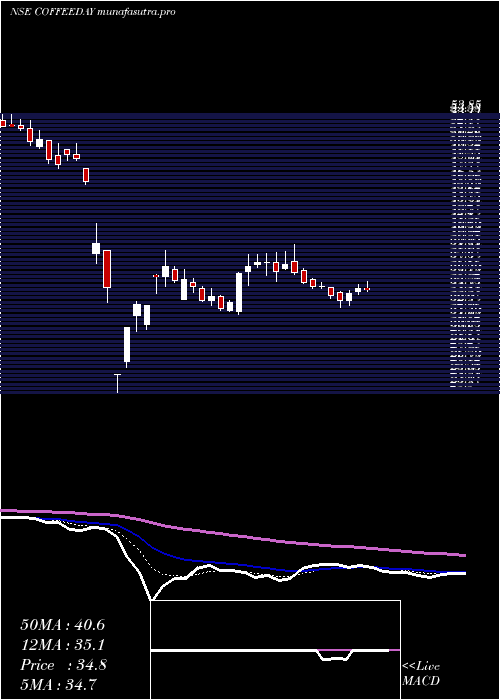
Daily price and volume Coffee Day
| Date |
Closing |
Open |
Range |
Volume |
Tue 02 September 2025 |
47.68 (0.97%) |
47.95 |
46.90 - 50.54 |
0.971 times |
Mon 01 September 2025 |
47.22 (-5.62%) |
51.19 |
46.50 - 51.46 |
1.5382 times |
Fri 29 August 2025 |
50.03 (17.61%) |
42.99 |
41.92 - 50.78 |
2.1628 times |
Thu 28 August 2025 |
42.54 (-0.98%) |
42.98 |
42.21 - 43.89 |
0.1609 times |
Tue 26 August 2025 |
42.96 (-0.07%) |
42.99 |
42.50 - 44.57 |
0.2718 times |
Mon 25 August 2025 |
42.99 (-3.02%) |
44.33 |
42.22 - 44.69 |
0.3204 times |
Fri 22 August 2025 |
44.33 (-4.01%) |
45.70 |
44.00 - 46.64 |
0.9448 times |
Thu 21 August 2025 |
46.18 (16.12%) |
40.15 |
39.90 - 47.45 |
2.9242 times |
Wed 20 August 2025 |
39.77 (0.89%) |
39.61 |
38.64 - 41.27 |
0.4973 times |
Tue 19 August 2025 |
39.42 (3.55%) |
38.07 |
37.77 - 39.90 |
0.2086 times |
Mon 18 August 2025 |
38.07 (0.29%) |
40.44 |
37.35 - 40.44 |
0.3862 times |
Weekly price and charts CoffeeDay Strong weekly Stock price targets for CoffeeDay COFFEEDAY are 44.61 and 49.57 | Weekly Target 1 | 43.59 | | Weekly Target 2 | 45.63 | | Weekly Target 3 | 48.546666666667 | | Weekly Target 4 | 50.59 | | Weekly Target 5 | 53.51 |
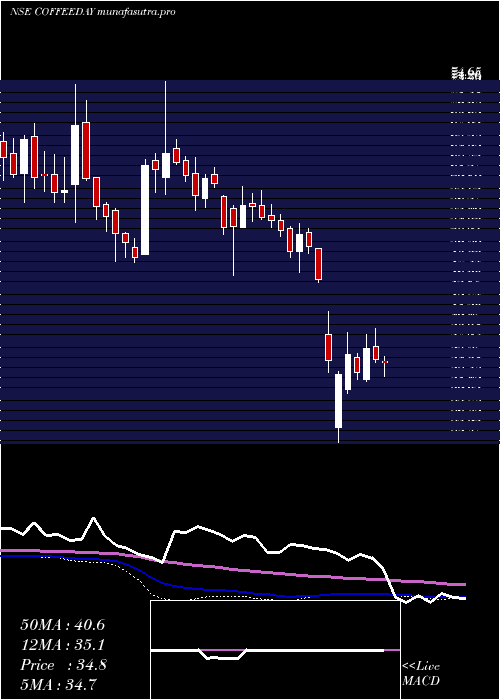
Weekly price and volumes for Coffee Day
| Date |
Closing |
Open |
Range |
Volume |
Tue 02 September 2025 |
47.68 (-4.7%) |
51.19 |
46.50 - 51.46 |
1.3802 times |
Fri 29 August 2025 |
50.03 (12.86%) |
44.33 |
41.92 - 50.78 |
1.6039 times |
Fri 22 August 2025 |
44.33 (16.78%) |
40.44 |
37.35 - 47.45 |
2.7288 times |
Thu 14 August 2025 |
37.96 (5.3%) |
35.31 |
35.31 - 39.00 |
0.4281 times |
Fri 08 August 2025 |
36.05 (2.07%) |
35.67 |
34.21 - 38.10 |
0.4765 times |
Fri 01 August 2025 |
35.32 (-2.02%) |
36.01 |
34.11 - 38.14 |
0.5726 times |
Fri 25 July 2025 |
36.05 (-8.66%) |
39.48 |
35.52 - 40.40 |
0.4199 times |
Fri 18 July 2025 |
39.47 (13.45%) |
34.77 |
33.50 - 42.40 |
1.7832 times |
Fri 11 July 2025 |
34.79 (-1%) |
34.96 |
32.77 - 35.63 |
0.2387 times |
Fri 04 July 2025 |
35.14 (-4.46%) |
37.04 |
34.84 - 39.65 |
0.3681 times |
Fri 27 June 2025 |
36.78 (10.42%) |
32.41 |
32.05 - 38.75 |
0.7215 times |
Monthly price and charts CoffeeDay Strong monthly Stock price targets for CoffeeDay COFFEEDAY are 44.61 and 49.57 | Monthly Target 1 | 43.59 | | Monthly Target 2 | 45.63 | | Monthly Target 3 | 48.546666666667 | | Monthly Target 4 | 50.59 | | Monthly Target 5 | 53.51 |
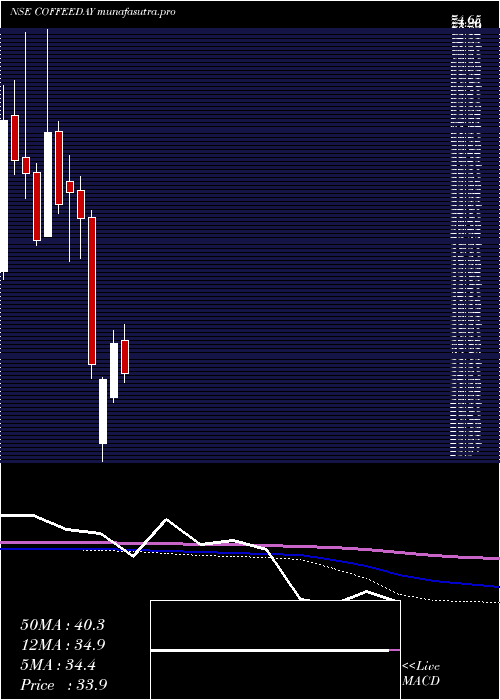
Monthly price and volumes Coffee Day
| Date |
Closing |
Open |
Range |
Volume |
Tue 02 September 2025 |
47.68 (-4.7%) |
51.19 |
46.50 - 51.46 |
0.349 times |
Fri 29 August 2025 |
50.03 (39.94%) |
36.60 |
34.21 - 50.78 |
1.3478 times |
Thu 31 July 2025 |
35.75 (-4.54%) |
37.84 |
32.77 - 42.40 |
0.8103 times |
Mon 30 June 2025 |
37.45 (13.01%) |
31.00 |
30.40 - 38.99 |
0.4405 times |
Wed 05 March 2025 |
33.14 (-5.31%) |
25.53 |
23.50 - 33.44 |
0.2859 times |
Tue 13 August 2024 |
35.00 (-33.09%) |
52.33 |
33.30 - 53.18 |
0.9535 times |
Wed 31 July 2024 |
52.31 (-5.44%) |
55.60 |
47.50 - 57.25 |
0.811 times |
Fri 28 June 2024 |
55.32 (2.63%) |
56.60 |
47.10 - 59.70 |
0.9025 times |
Fri 31 May 2024 |
53.90 (-13.69%) |
62.55 |
52.90 - 63.80 |
1.0253 times |
Tue 30 April 2024 |
62.45 (25.78%) |
50.15 |
50.15 - 74.65 |
3.0742 times |
Thu 28 March 2024 |
49.65 (-13.73%) |
57.65 |
49.00 - 58.80 |
1.0764 times |
DMA SMA EMA moving averages of Coffee Day COFFEEDAY
DMA (daily moving average) of Coffee Day COFFEEDAY
| DMA period | DMA value | | 5 day DMA | 46.09 | | 12 day DMA | 43.26 | | 20 day DMA | 40.3 | | 35 day DMA | 38.88 | | 50 day DMA | 37.97 | | 100 day DMA | 42.55 | | 150 day DMA | 48.16 | | 200 day DMA | 50.47 | EMA (exponential moving average) of Coffee Day COFFEEDAY
| EMA period | EMA current | EMA prev | EMA prev2 | | 5 day EMA | 46.42 | 45.79 | 45.08 | | 12 day EMA | 43.78 | 43.07 | 42.32 | | 20 day EMA | 41.89 | 41.28 | 40.65 | | 35 day EMA | 39.93 | 39.47 | 39.01 | | 50 day EMA | 38.44 | 38.06 | 37.69 |
SMA (simple moving average) of Coffee Day COFFEEDAY
| SMA period | SMA current | SMA prev | SMA prev2 | | 5 day SMA | 46.09 | 45.15 | 44.57 | | 12 day SMA | 43.26 | 42.46 | 41.51 | | 20 day SMA | 40.3 | 39.68 | 39.11 | | 35 day SMA | 38.88 | 38.51 | 38.16 | | 50 day SMA | 37.97 | 37.68 | 37.39 | | 100 day SMA | 42.55 | 42.65 | 42.72 | | 150 day SMA | 48.16 | 48.27 | 48.36 | | 200 day SMA | 50.47 | 50.53 | 50.61 |
|
|
